
Figure 8.
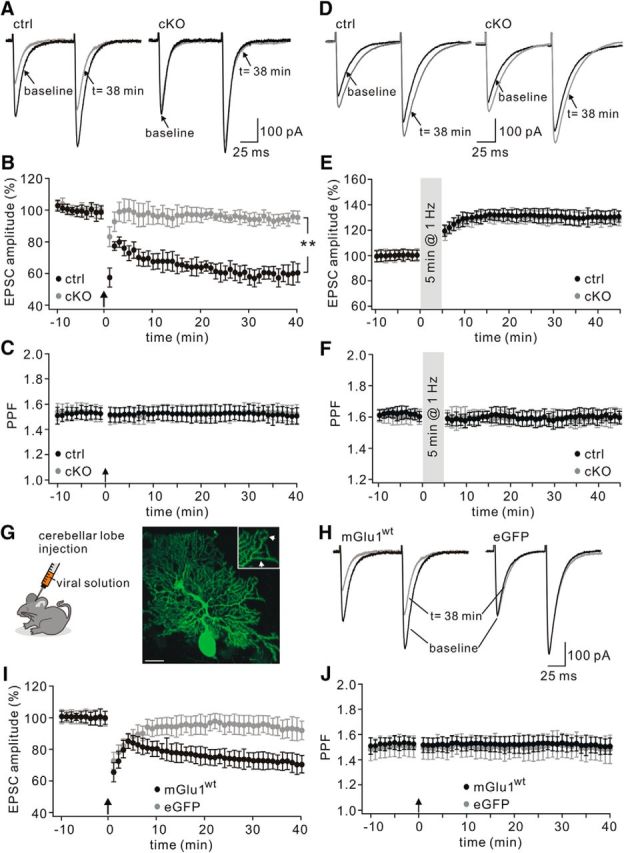
LTD is deficient whereas LTP is normal in TFR1flox/flox;pCP2-cre mice. A, Example parallel fiber–EPSCs before (baseline) and after (t = 38 min) LTD stimulation in control and cKO PCs. B, Time course of percentage changes of EPSC1 amplitudes in control and cKO animals. Each data point represents the average of three successive EPSCs evoked at 0.05 Hz. The upward arrow shows LTD tetnus. **p < 0.01. C, Time course of PPF (EPSC2/EPSC1) from the cells shown in B. D, Example EPSCs before (baseline) and after (t = 38 min) LTP stimulation. E, Time course of percentage changes of EPSC amplitude in control and cKO mice. Each data point represents the average of three successive EPSCs evoked at 0.05 Hz. F, Time courses of PPF ratios from the subset of cells shown in E. G, Schema showing SFV injection into the vermis cerebellum. Eighteen hours after injection, eGFP signals were observed in scattered PCs (right). The amplification shows the affected spines (arrowheads) in distal dendrites. Scale bar, 20 μm. H, Representative traces of EPSCs recorded from cKO PCs expressing eGFP or eGFP+mGlu1 (mGlu1) before (baseline) and after (t = 38 min) LTD induction. I, Time course of percentage changes of EPSC amplitudes in cKO PCs transduced by eGFP or mGlu1. J, Time course of PPFs shown in I.