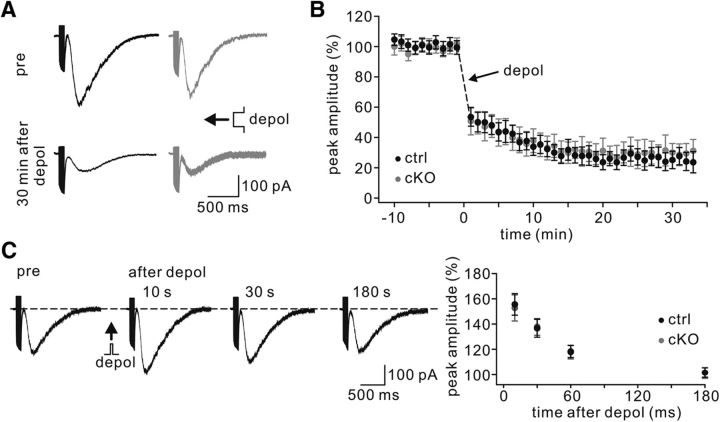
Figure 9.
LTD and STP of mGlu1 are unaltered in TFR1flox/flox;pCP2-cre mice. A, Example mGlu1-EPSCs before and after mGlu1-LTD induction in control and cKO cells. Current amplitudes were measured at the peak of slow EPSCs. B, Time course of percentage changes in mGlu1-EPSC amplitudes from control (n = 12) and cKO (n = 12) cells induced by 5 s depolarization at the time indicated by the arrow. C, Representative mGlu1 traces showing four different trials before (pre) and 10, 30, 60, and 180 s after a transient depolarization from one cell. Right, Time course of percentage changes of mGlu1-EPSCs in control (n = 10) and cKO (n = 9) cells.

