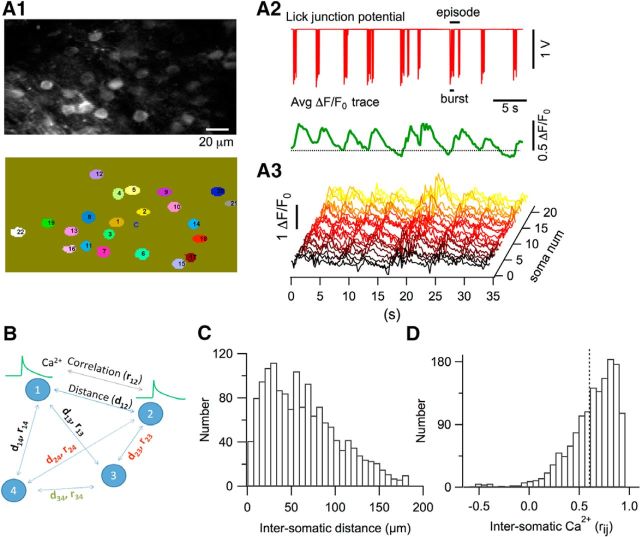
Figure 2.
Ca2+ transients in GCAMP6s-expressing stellate cells during rhythmic licking. A1, Top, Average two-photon image of the molecular layer during a licking session. Bottom, Ovals with numbers identify single stellate cell somata, which were traced with ImageJ software and then automatically scrutinized and numbered with MATLAB routines. A2, Top, Electrical signal generated by licking episodes. Bottom, Average of the time-dependent ΔF/F0 traces for the 21 stellate cells outlined in A1. The dotted line marks the zero ΔF/F0 level. A3, Corresponding waterfall plot for individual stellate cells. B, Schematics for the calculation of rij between Ca2+ responses of all combined neuron pairs and the corresponding dij. C, Histogram distribution of the distances of stellate cell pairs. D, Histogram distribution of all soma-to-soma correlations in Ca2+ responses. The dotted line marks the mean value. A total of 1494 combined neuronal pairs were analyzed in 14 imaging runs from n = 4 mice.

