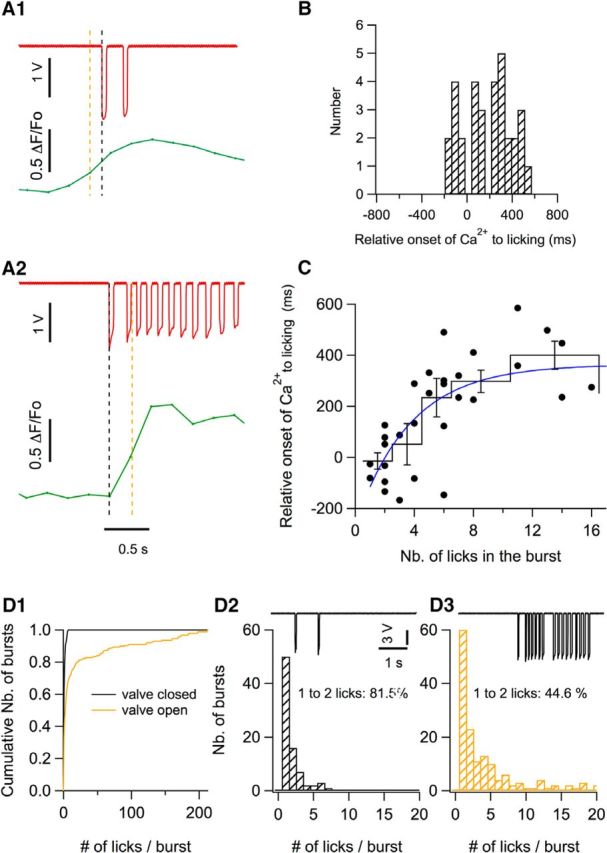
Figure 3.

Temporal correlation between licking behavior and Ca2+ rises. A1, A2, Two examples of lick bursts (red) and of the corresponding averaged ΔF/F0 traces (green) illustrate the analysis done to determine the relative onset of the Ca2+ signal with respect to the licking trace. The black dotted line marks the onset time for licking, determined as the first data point that deviates from the baseline by >3 times the SD. The green trace shows the Ca2+ signal corresponding to a time window ranging from −1 s to 1.5 s with respect to licking onset. The Ca2+ onset time (orange dotted line) was determined as the first data point deviating by >3 times the SD from the Ca2+ trace baseline. In one case, the Ca2+ trace precedes licking onset (A1) and, in the other example, the Ca2+ trace lags after licking onset (A2). B, Distribution of the relative onset of the Ca2+ traces versus the licking traces, with a mean value of 183.6 ± 37.4 ms (n = 32 bursts from 8 imaging sections, n = 5 animals). C, Relationship between the Ca2+ onset time and the number of licks in the burst. The black circles show individual data points; the continuous black profile shows means ± SEM of binned data; blue curve shows the fit of the data points by an exponential function with a lick number parameter value of 3.7 licks and a saturation at 364 ms. D, Comparison of the distribution of number of licks per burst when a valve controlling water delivery is closed (black cumulative histogram in D1; corresponding expanded histogram in D2) and when the valve is open (yellow plot in D1; corresponding histogram in D3). The traces in D2 and D3 show examples of licking recording when the valve is closed (D2) or open (D3). The histograms correspond to data pooled from 9 licking sessions from n = 3 mice.
