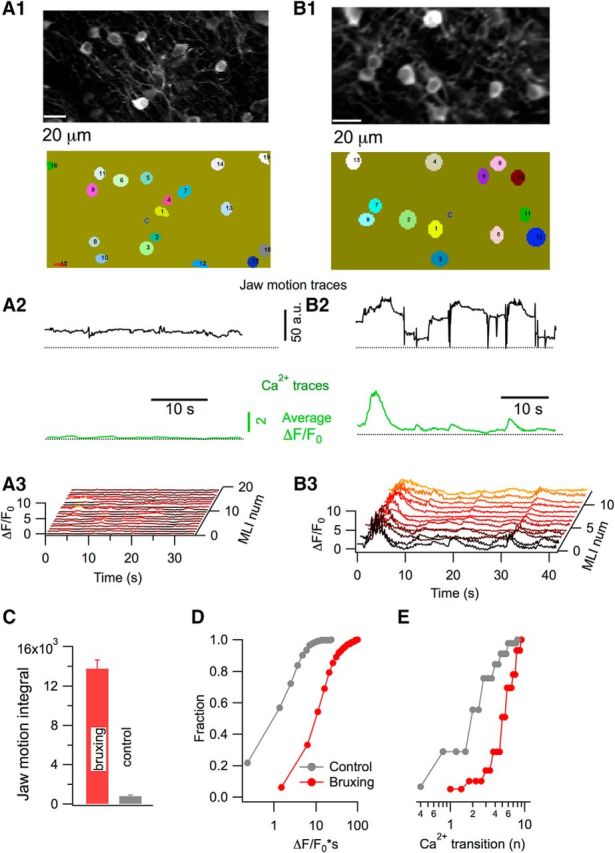
Figure 4.

Stellate cells Ca2+ signals during bruxing. A1, B1, GCAMP6-expressing stellate cells imaged by two- photon microscopy (top) and the ROIs used for analysis (bottom). A2, B2, Representative traces for jaw motion (black) and Ca2+ (green) for periods of low and high jaw motility. Jaw motility traces were extracted from infrared video imaging and the Ca2+ corresponds to the average of 19 individual stellate cells in A2 and 13 in B2. A3, B3, Corresponding waterfall plots for individual stellate cells. C, Comparison of the jaw motion integral in periods of high and low motility shows a marked difference between the two groups (t = 10.2; p < 0.0001). D, Ca2+ strength is significantly higher for periods of high motility than during low-motility sessions (t = 13.4; p < 0.0001). E, Difference between the two conditions is also highly significant when the number of Ca2+ transitions is compared (t = 7.3; p < 0.0001). Data for C–E are from three mice, 788 stellate cells from 50 imaging runs during high-motility periods, and 364 stellate cells from 27 imaging runs during low-motility periods.
