Figure 6.

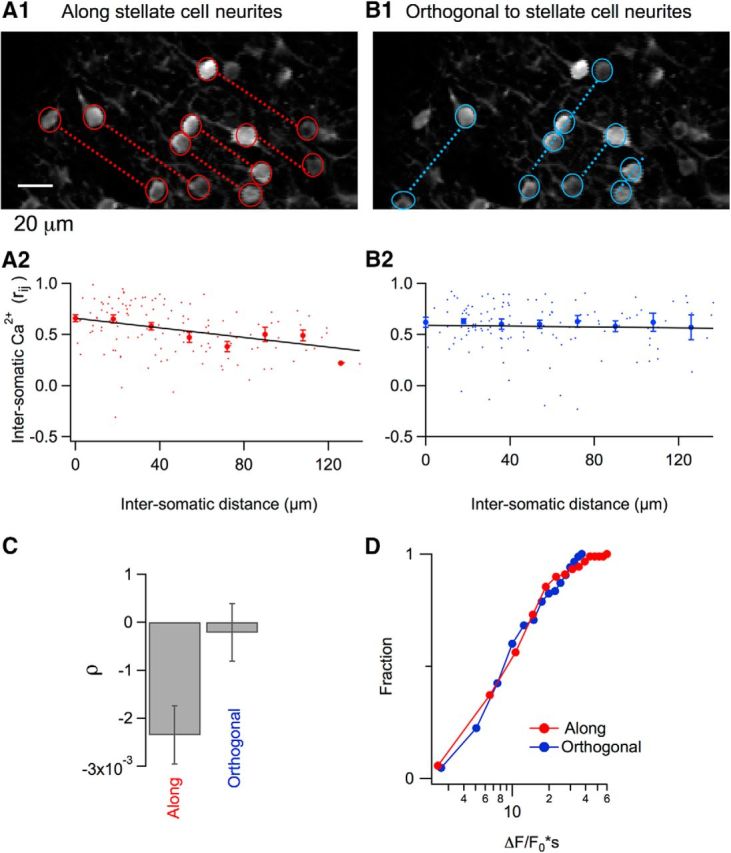
Spatial dependence of somatic Ca2+ correlations during licking. A1, Two-photon image in which individual stellate cell somata are marked with red circles and dotted lines join somata oriented along the axis of stellate cell neurites. A2, Red dots show individual rij values plotted against soma-to-soma distances. Red filled circles correspond to the mean ± SEM for 18 μm bins running over the whole range of distances. The black line shows the fit of the data by a linear function that yields a significant negative correlation with a slope of −0.0023 ± 0.0006 (t = 3.8, p < 0.001; 130 stellate cell pairs from 13 imaging runs, n = 4 mice). B1, B2, Similar analysis of the same data pool for stellate cells oriented orthogonally to the neurites. In this case, the fit of the data by a linear regression yields a slope value of −0.0002 ± 0.0006 (t = 0.36, p > 0.5; 125 stellate cell pairs from 15 imaging runs, n = 4 mice), indicating that there is no significant dependence of the correlation on distance. C, Pooled results for the dependence of correlation of the Ca2+ responses on the distance for the two orientations. D, No difference was found for the Ca2+ signal integral when stellate cells were compared in the two orientations (t = 0.49; p > 0.5; 85 and 81 stellate cells from 13 and15 imaging runs, respectively; n = 4 mice).
