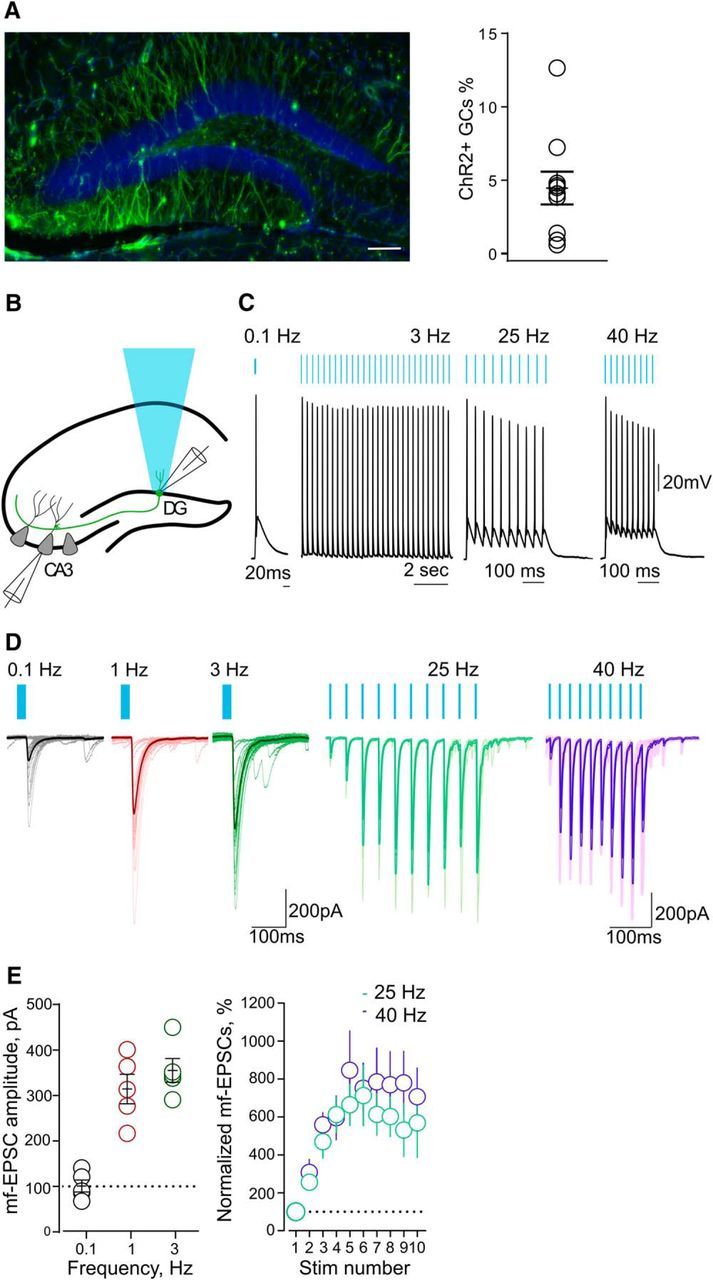
Figure 1.

Light-induced short-term plasticity at mf–CA3 synapses in slices. A, Confocal fluorescent image (left) illustrating ChR2-EYFP expression in GCs of the DG. Scale bar, 100 μm. On the right, a summary plot shows the percentage of GCs expressing ChR2-EYFP (right; n = 10 mice). B, Schematic illustration of the hippocampus for experimental settings during optical stimulation of GCs in acute slices. C, Current-clamp recordings showing DG cell firing in response to patterned blue light (0.1–40 Hz). Blue bars indicate light stimulation. D, Representative traces of 30 consecutive mf–EPSCs evoked at 0.1–3 Hz. Averaged traces are superimposed (left). Representative traces of mf–EPSCs evoked with trains of light stimulation at 25 and 40 Hz. Averaged traces are superimposed (right). E, Summary graph of averaged mf-EPSCs amplitude (n = 5) evoked at 0.1–3 Hz (left). Averaged time courses (n = 5) for the normalized mf-EPSCs amplitude evoked at 25 and 40 Hz (right).
