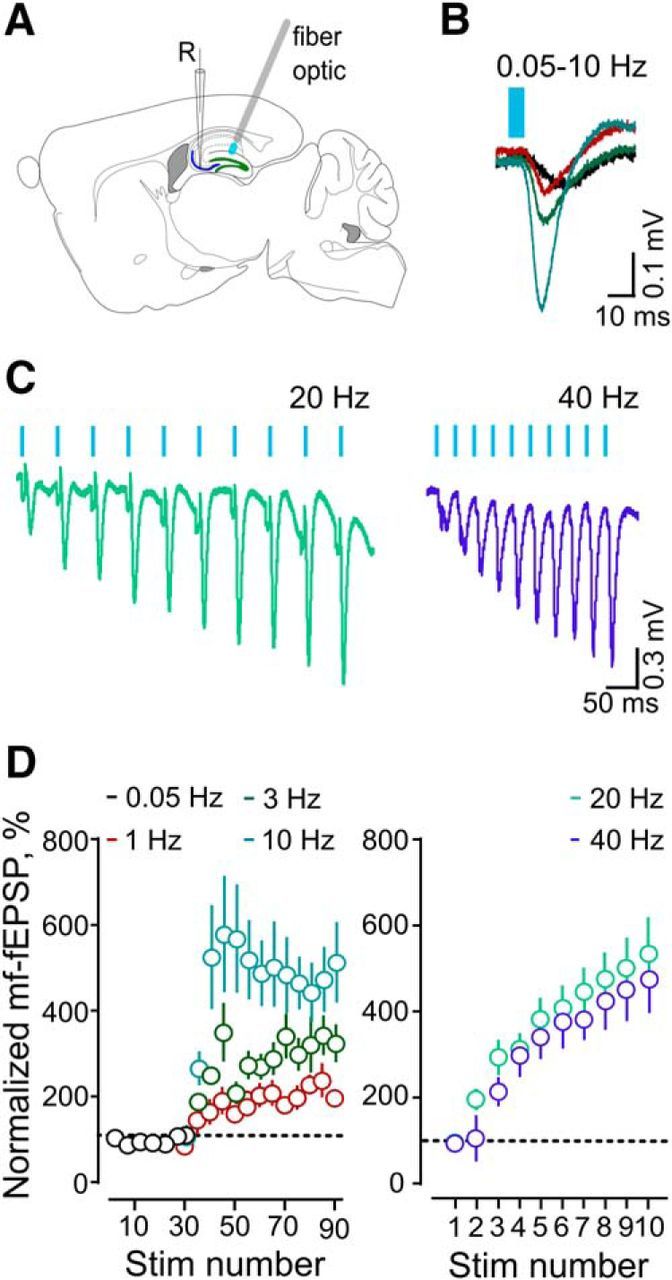
Figure 2.

In vivo characterization of mf–CA3 synaptic responses. A, Scheme showing the placement of fiber-optic and recording electrodes (R) for fEPSP. B, Representative fEPSP average traces obtained with optical stimulation at 0.05–10 Hz (n = 8). C, Representative fEPSP average traces obtained with five trains of optical stimulation at 20 Hz (n = 14) and 40 Hz (n = 12). D, Averaged time courses for the normalized fEPSPs slopes shown in B (left) and C (right).
