Figure 5.

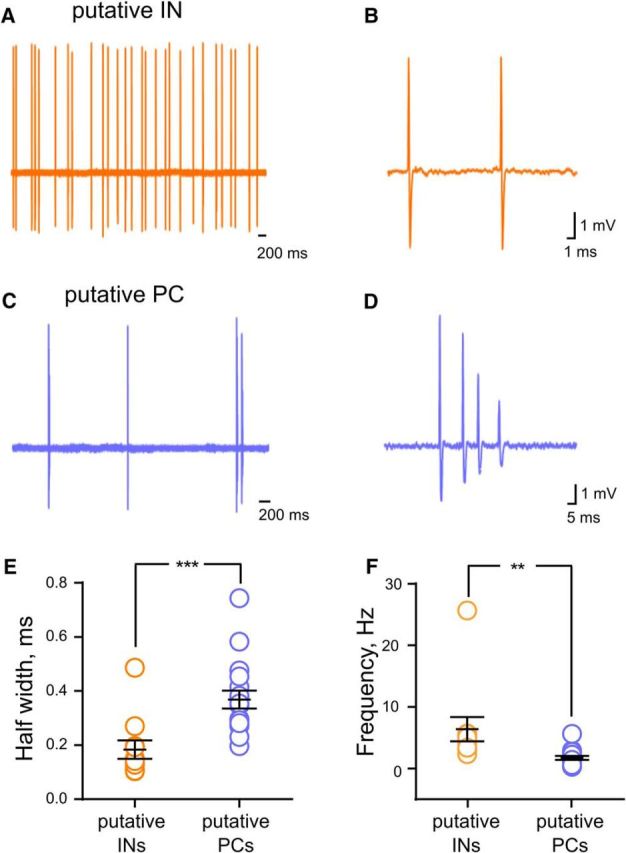
Characterization of CA3 neurons firing in vivo with juxtacellular recordings. A, Representative high-pass-filtered (100 Hz) spike traces recorded from a putative CA3 IN. B, Trace illustrating the action potential shape from the same cell in A. C, Representative high-pass-filtered (100 Hz) spike traces recorded from a putative CA3 PC. D, Trace showing a typical burst of action potential from the same cell in C. E, Scatter plot graph showing average half-width of the action potentials recorded from putative CA3 INs (orange) and putative CA3 PCs (violet). F, Scatter plot graph showing the average spontaneous frequency of action potentials recorded from putative INs (orange, n = 11) and putative PCs (violet, n = 17).
