Figure 2.
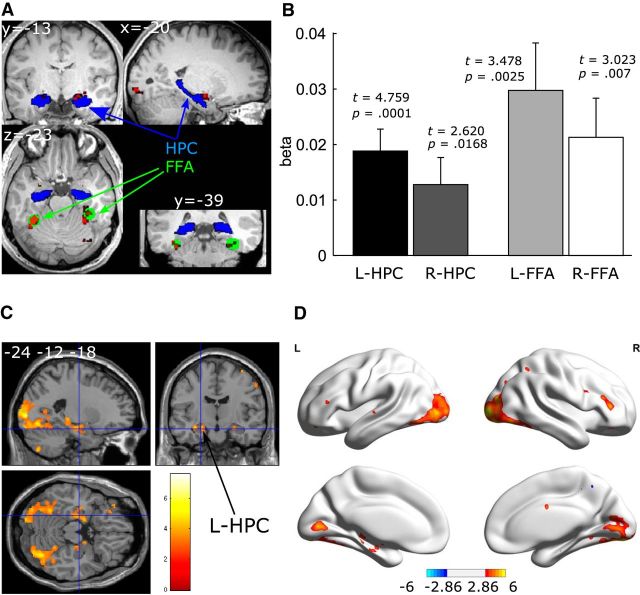
The number of gaze fixations positively predicts activation in the hippocampus (HPC) and FFA bilaterally. A, Individual anatomical HPC ROIs (in blue) are shown for a representative participant in MNI space. Group-level functional FFA ROIs are illustrated in green and activation clusters are presented in red for viewing of novel versus repeated faces (familywise error = 0.05). B, Results for the anatomical HPC ROIs and functional FFA ROIs (two-tailed t test). For illustration purposes, brain section (C) and surface (D) views are also presented at p = 0.005, 10-voxel extension with no corrections. For the brain surface views, L indicates left hemisphere and R the right hemisphere.

