Figure 2.
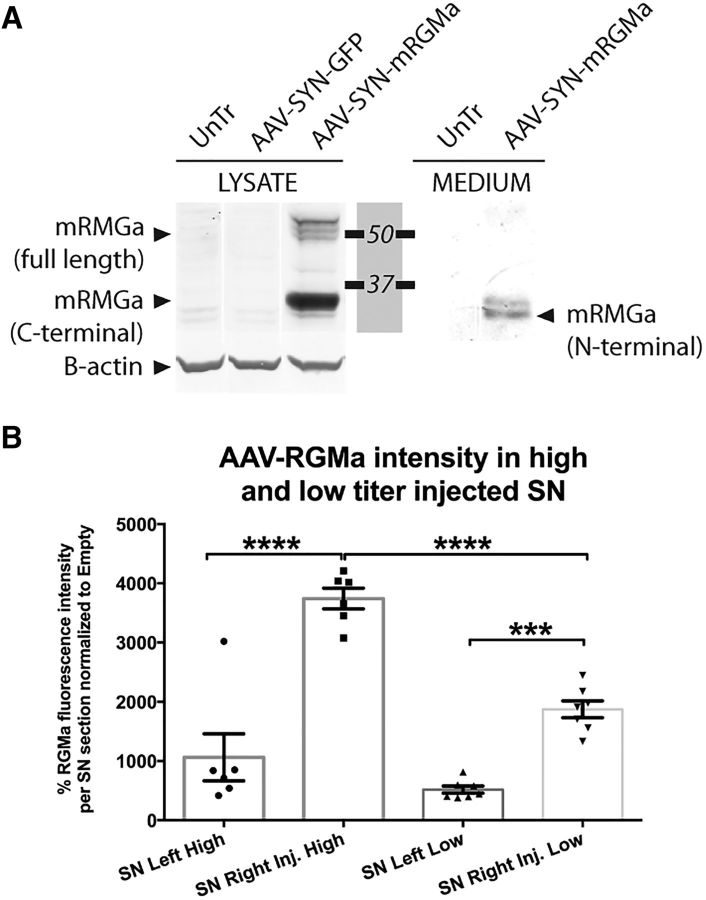
AAV vectors direct RGMa expression and secretion in a neuronal cell line and dose-dependent expression in the mouse brain. A, AAV plasmid-mediated overexpression of mouse RGMa in N2A cells results in the production and secretion of RGMa protein. N2A cells were either untreated (UnTr) or transfected with the expression plasmids pAAV-SYN-GFP or pAAV-SYN-mRGMa. Anti-mouse RGMa antibody (R&D Systems, AF2458) was used to detect mouse RGMa protein in the cell lysate (LYSATE samples) or the culture medium (MEDIUM samples) 3 d after transfection. N2A cells produce mouse RGMa after transfection of the expected molecular weight: multiple bands are visible ∼49–55 kDa representing the full-length form, and one prominent band at 33 kDa representing the cleaved membrane bound C-terminal form. RGMa is also released from the transfected N2A cells, which results in the N-terminal 30 kDa form of RGMa in the medium samples. β-actin was used as loading control. B, Comparison of RGMa protein levels in the SN of mouse injected with a high titer (9.0 × 10¹² gc/ml) and low titer (3.0 × 10¹² gc.ml). The RGMa fluorescence was twice as high in the high-titer-injected mice compared with the low-titer-injected mice (p < 0.0001, F(3,22) = 41.21). Data are represented in percentages of RGMa fluorescence levels relative to the AAV-Empty RGMa. Tissue from 6 mice was quantified in the high-titer treatment group, and from 7–8 mice in low-titer treatment group. Example images used for the quantification of RGMa are shown in Figure 6B (high-dose experiment) and Figure 7B (low-dose experiment). Statistical analysis was performed using one-way ANOVA with Tukey's post hoc multiple testing correction: ***p < 0.001; ****p < 0.0001. All data are expressed as mean with bars representing SEM.

