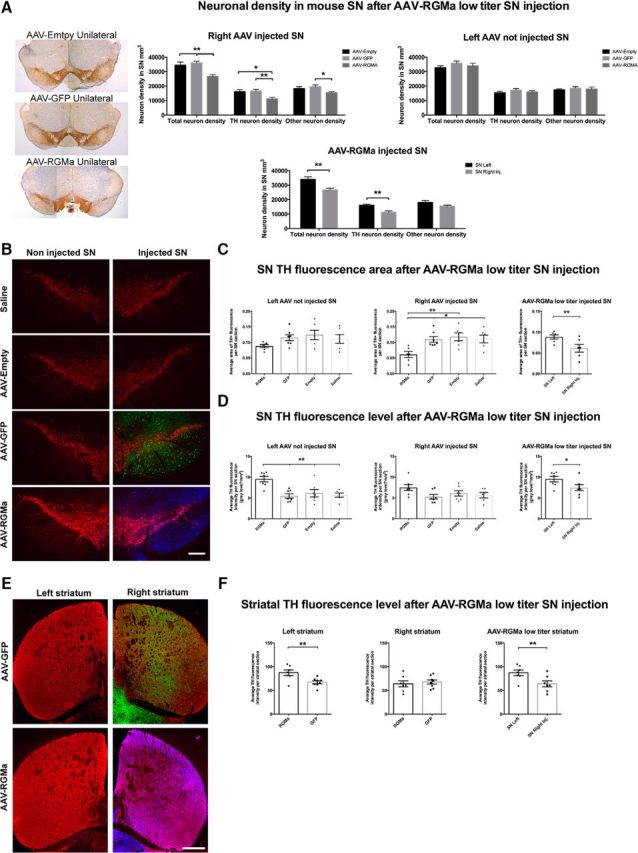
Figure 7.

Low-dose AAV-mediated overexpression of RGMa induced a decline in DA neurons and increase in TH protein levels indicative of a compensation mechanism. A, Quantification of the neuronal density in AAV-Empty, AAV-GFP, and AAV-RGMa-injected and noninjected SN. RGMa overexpression resulted in a decrease in both the total (23% and 26%) and TH+ (30% and 33%) neuronal density in the AAV-RGMa-injected SN compared with the AAV-Empty and AAV-GFP injected SN (total neurons: p = 0.0015, F(2,19) = 9.318; TH neurons: p = 0.0041, F(2,19) = 7.449). TH− neurons were generally not affected by RGMa overexpression, with an exception compared with AAV-GFP-injected SN (p = 0.0488, F(2,19) = 3.555). Total and TH+ neuronal density was significantly decreased in the AAV-RGMa-injected SN compared with the not injected SN (p = 0.0029 and p = 0.0018, respectively). B, Immunohistochemical staining for TH (red), GFP (green), and RGMa (blue) in the SN injected with saline, AAV-Empty, AAV-GFP, or AAV-RGMA virus. C, Quantification of TH+ area in the SN. The TH+ area was significantly decreased in the SN injected with AAV-RGMa compared with all control groups (p = 0.0063, F(3,21) = 5.44) as well as to the contralateral (noninjected) SN of the RGMa-treated animals (p = 0.0073). D, Quantification of TH fluorescence levels in the SN. Overexpression of RGMa in the SN is associated with an increase in TH fluorescence in the noninjected contralateral SN compared with all control groups (p = 0.0006, F(3,23) = 8.3). TH fluorescence intensity in the AAV-RGMa-injected SN is not altered compared with the control treatment groups. E, Immunohistochemical staining for TH (red), GFP (green), and RGMa (blue; antibody SC-46482) in the striatum following the transduction of the SN with AAV-GFP or AAV-RGMa. Both GFP and RGMa protein is transported from the injected (right) SN to the nigrostriatal projection target sites in the right striatum. F, Quantification of TH fluorescence intensity in the striatum. Overexpression of RGMa in the SN is associated with an increase in TH fluorescence intensity in the left contralateral striatum compared with the AAV-GFP control striatum (p = 0.0082) and compared with the right AAV-RGMa striatum (p = 0.0037). TH fluorescent levels in the right striatum were not different in the AAV-RGMa group compared with all three control treatment groups (p = 0.6139). Each treatment group includes 7–8 animals per quantification, with the saline group containing 6 animals. Statistical analysis was performed using one-way ANOVA with Tukey's post hoc multiple testing correction and Student's t test: *p < 0.05; **p < 0.01; ***p < 0.001; ****p < 0.0001. All data are expressed as mean with bars representing SEM. Scale bars: B, 0.25 mm; E, 0.5 mm.
