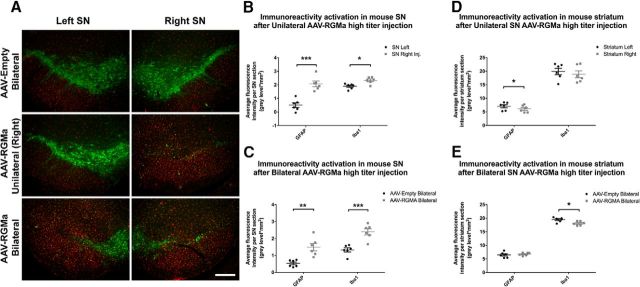
Figure 8.
High-dose AAV-mediated overexpression of RGMa in the mouse SN induced a gliotic response. A, Immunohistochemical staining for TH (green) and Iba1 (red) in the SN injected with high-titer AAV-Empty bilaterally, AAV-RGMa unilaterally, and AAV-RGMa bilaterally. Scale bar, 0.25 mm. Immunohistochemical stanining for GFAP (red) in the injected SN has been visualized in Fig. 6B. B, Quantification of fluorescence signal in the SN of mice receiving a unilateral injection of high-titer AAV-RGMa. GFAP and Iba1 fluorescence intensities are increased in the AAV-RGMa-injected (right) SN compared with the noninjected (left) SN. C, Quantification of fluorescence signal in the SN of mice receiving a bilateral injection of high-titer AAV-Empty or the AAV-RGMa viral vector. GFAP and Iba1 intensities are increased in the AAV-RGMa-injected SN compared with the AAV-Empty-injected animals. Fluorescence intensities from right and left SN were averaged across both SN to provide the total fluorescence intensity per entire SN in each bilateral AAV treatment. D, Quantification of fluorescence signal in the striatum of mice receiving a unilateral injection of high-titer AAV-RGMa in the SN. GFAP fluorescence intensity is slightly decreased in the right (injected) striatum compared with the left (p = 0.027). We observed no differences in Iba1 levels between the two hemispheres. E, Quantification of fluorescence signal in the striatum of mice receiving a bilateral injection of high-titer AAV-Empty or AAV-RGMa virus in the SN. We observed no differences in GFAP fluorescence intensities between the two groups. Iba1 fluorescence intensity is slightly decreased in the striatum of AAV-RGMa-injected mice compared with the AAV-Empty-injected animals (p = 0.015). Fluorescence intensities from right and left striata were averaged across both striata to provide the total fluorescence intensity per AAV treatment. Each treatment group includes 6 animals per quantification. Statistical analysis was performed using Student's t test: *p < 0.05; **p < 0.01; ***p < 0.001. All data are expressed as mean with bars representing SEM.

