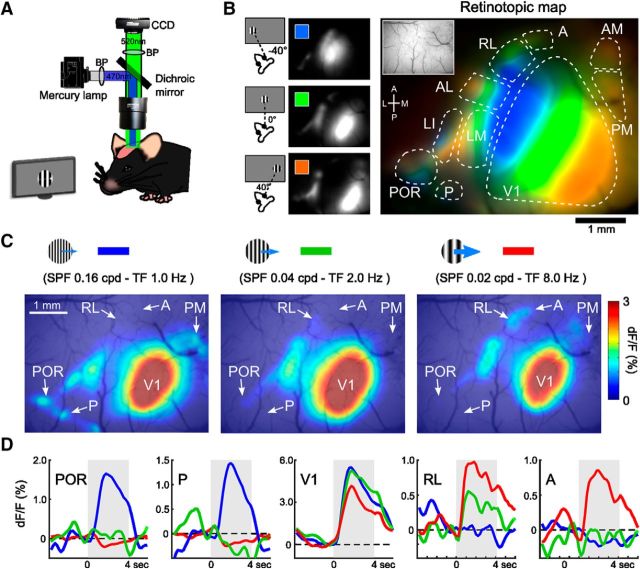
Figure 1.
Determination of areal position using retinotopic mapping and the visual response to grating stimuli for various spatiotemporal frequencies. A, Experimental setup of wide-field Ca2+ imaging. B, Retinotopic structure of V1 and HVAs in the entire visual cortex. Left, Maps of the calcium visual responses to grating stimuli (40° diameter, smooth edges) that were presented at different horizontal positions on the monitor with 40° intervals. Right, Merged map of the three response maps on the left showing retinotopic structures of V1 and HVAs. The inset is a region of interest in the imaging experiment. C, Examples of the responses to grating stimuli with three different spatiotemporal parameters. Grating stimuli with high SPF and low TF evoked response in lateral and medial HVAs (left), whereas stimuli with low SPF and low TF evoked response in anterior HVAs (right). D, Average time courses of calcium responses in V1 and four HVAs (POR, P, RL, and A). The line colors correspond to the three stimulus parameters in the top panels. These response maps and time courses show the visual responses and areal positions of P and A, which are obscured in the retinotopic map in B.

