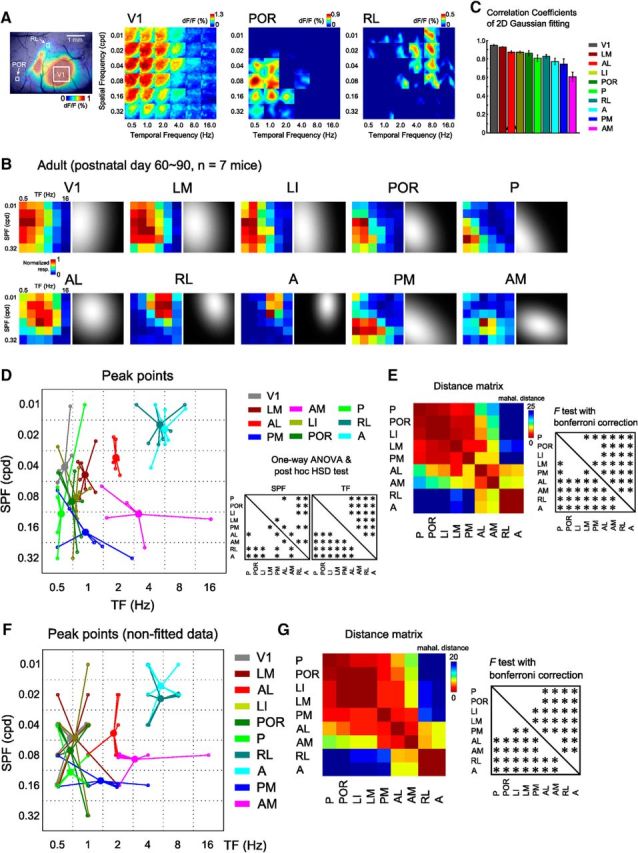
Figure 3.

Functional classification of HVAs by a discriminant analysis performed on the spatiotemporal selectivity. A, Examples of the calcium visual responses to the 36 gratings in areas V1, POR, and RL. Left, ROIs in each area. Areas POR and RL exhibited distinctly different preferences, such that area POR was strongly responsive to high SPF and low TF stimuli, whereas area RL was responsive to low SPF and high TF stimuli. B, Response matrices of V1 and nine HVAs fitted with 2D Gaussian fitting in adult mice. The left color-coded matrix in each area is the averaged response matrices before the Gaussian fitting. C, Correlations of response matrices between before and after Gaussian fit. The correlation coefficients were high across all the visual areas. D, Peak points of the fitted response matrix in adult mice (n = 7 mice). Small open circles indicate the individual data. Large filled circles are averages of the open circles. Areas LI, POR, P, and PM preferred high SPF and low TF stimuli, whereas areas RL and A preferred low SPF and high TF stimuli. Among nine HVAs, areas LM and AL had intermediate properties. Area AM had a preference for high SPF and high TF stimuli. The differences in spatiotemporal selectivity between HVAs are significant (one-way ANOVA, SPF: F(8,52) = 10.78, p < 8.60 × 10⁻⁹; TF: F(8,52) = 33.72, p < 10−18; post hoc Tukey's HSD test, p < 0.05). E, Inter-areal distance matrix representing the Mahalanobis distances of functional properties among HVAs. Areas LM, LI, POR, P, and PM in the putative ventral stream were significantly separated from areas AL, AM, RL, and A (p < 0.0014, F test with Bonferroni correction). Within the putative dorsal stream, areas AL, PM, AM, RL, and A were not functionally uniform. F, Peak points of the response matrices before Gaussian fit in adult mice. Small open circles indicate the individual data. Large circles are averages of individual data. G, Inter-areal distance matrix representing the Mahalanobis distances of the nonfitted data among HVAs.
