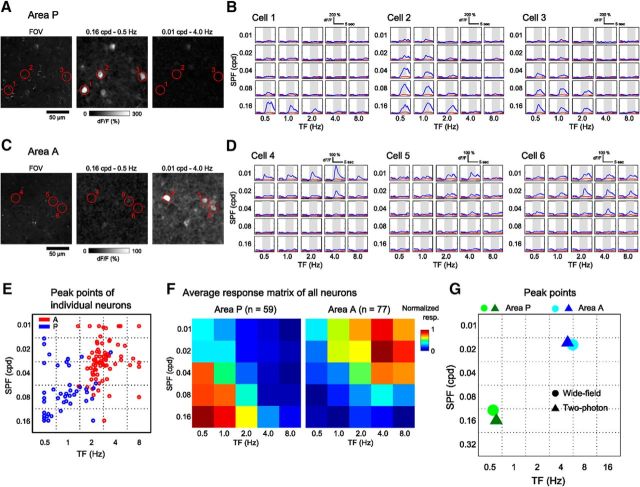
Figure 4.
Spatiotemporal preferences of individual neurons in areas P and A. A, Examples of the neural responses in area P to grating stimuli with two different spatiotemporal parameters. Left, Extracted FOV. Grating stimuli with high SPF and low TF evoked calcium responses of neurons (middle), whereas stimuli with low SPF and high TF did not (right). B, Averaged time courses of representative neurons marked in A. These neurons preferred gratings with high SPF and low TF. Gray shading indicates the stimulus periods. The red lines indicate the signals of neuropil around neurons. Neuropil signals were negligible compared with those of neurons. C, D, Examples of the neural responses in area A to grating stimuli with two different spatiotemporal parameters. The neurons in the FOV showed the strongest responses to grating stimuli with low SPF and high TF. E, Peak points of the fitted response matrices of individual neurons. Most of neurons in areas P and A preferred the gratings with high SPF and low TF and those with low SPF and high TF, respectively. F, Average response matrices of all neurons in areas P and A (n = 59 and 77 neurons in areas P and A from two mice, respectively). The matrices were normalized from 0 to 1, corresponding to minimum and maximum responses. G, Peak points of the fitted response matrices of areas P and A in two-photon and wide-field imaging experiments. The circles are peaks of the average response of all neurons in two-photon imaging (F), whereas the triangles show the averaged peaks of all mice in wide-field imaging (the same data shown in Fig. 3D).

