
Figure 6.
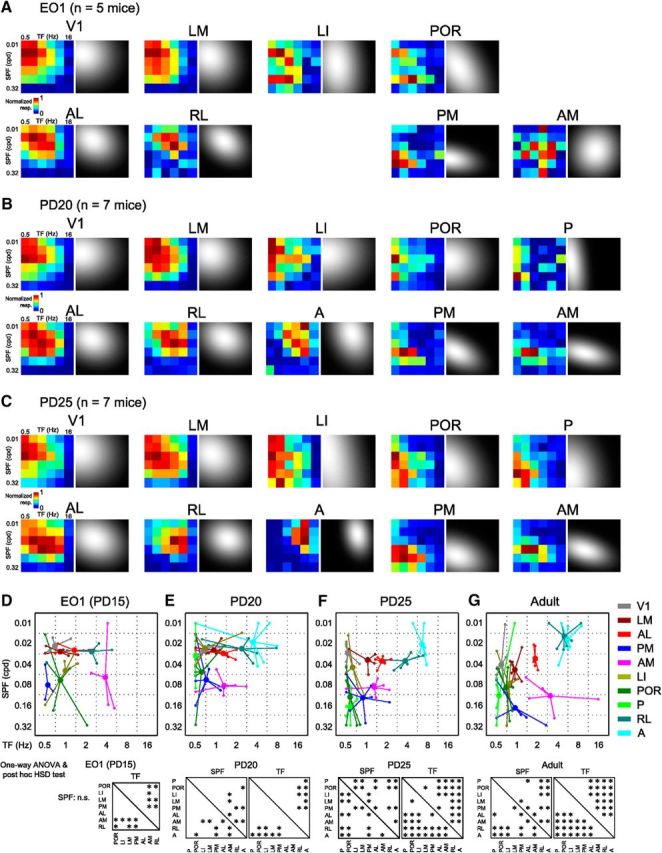
Spatiotemporal selectivity of developing HVAs at three time points. A–C, Response matrices of V1 and nine HVAs fitted with 2D Gaussian fitting in developing mice at EO1 (A), P20 (B), and P25 (C). The left color-coded matrix in each area is the averaged response matrices before the Gaussian fitting. D–G, Peak points of the fitted response matrices of developing mice at EO1 (D), P20 (E), P25 (F), and adult mice (G). Small open circles indicate the individual data. Large filled circles are averages of the open circles. The adult data (G) are the same as those described in Figure 3D. Bottom, Results of one-way ANOVA and post hoc test. For SPF preference, there was no main effect at EO1 (one-way ANOVA, F(6,24) = 1.85, p = 0.13). At P20, although there was a main effect on preferred SPF (one-way ANOVA, F(8,46) = 5.27, p < 0.0001), the number of significant differences was less than that in adults. For TF preference, there were main effects at EO1 and P20 (one-way ANOVA, EO1: F(6,24) = 7.2, p < 0.0002, p < 0.0004; P20: F(8,46) = 6.45, p < 1.32 × 10⁻⁵), but the number of significant differences was less than that in adults. At P25, the number of significant differences in both preferred SPF and TF was comparable to that in adults (one-way ANOVA, SPF: F(8,49) = 11.9, p < 10−9; TF: F(8,49) = 37.64, p < 10−18; post hoc Tukey's HSD test, p < 0.05).