Figure 5.
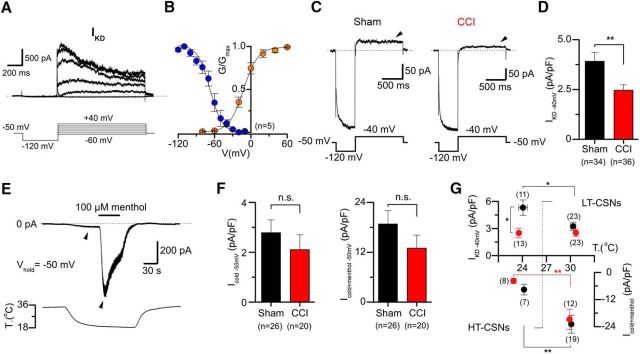
Biophysical properties of IKD and differential expression of IKD and ITRPM8 in CSNs from sham and CCI mice. A, 4-AP-sensitive currents (top), obtained from the digital subtraction of whole-cell currents in control and 100 μm 4-AP with an activation protocol in a CSN from a sham animal. The voltage protocol is shown at the bottom. Note the slow inactivation at negative membrane potentials. Dotted line indicates the 0 current level. B, Average activation (orange) and steady-state inactivation (blue) curves obtained from five control CSNs. Note the window current around the resting membrane potential. C, Whole-cell current in a representative CSNs from sham (left) and CCI (right) mice during a bipolar voltage protocol. The holding potential was −50 mV, and a hyperpolarizing pulse to −120 mV (see Materials and Methods) was applied before to reach the subthreshold membrane potential of −40 mV to reveal IKD. D, Mean IKD current density in sham (n = 34) and CCI (n = 36) CSNs: p = 0.003 (t test). E, Simultaneous recording of membrane current (top) and bath temperature (bottom) during a long cooling step (20°C) combined with application of menthol (100 μm) in a representative CSN from a sham animal. Dotted line indicates the 0 current level. F, Bar plot summarizing the mean Icold and Icold+menthol (ITRPM8) current density (measured at the pick of both currents) in 26 CSNs from sham and 20 CSNs from CCI animals (Vhold = −50 mV): p = 0.477 and p = 0.267 (t test), respectively. G, Dot plot of IKD and Icold+menthol current density in sham and CCI CSNs separated into HT- and LT-CSNs. The abscissa represents the thermal threshold, measured using [Ca2+]i imaging. *p < 0.05 (t test). **p < 0.01 (t test). Same as in C, IKD was measured at −40 mV 1 s after the return from a holding potential of −120 mV, in the presence of 0.5 μm TTx.

