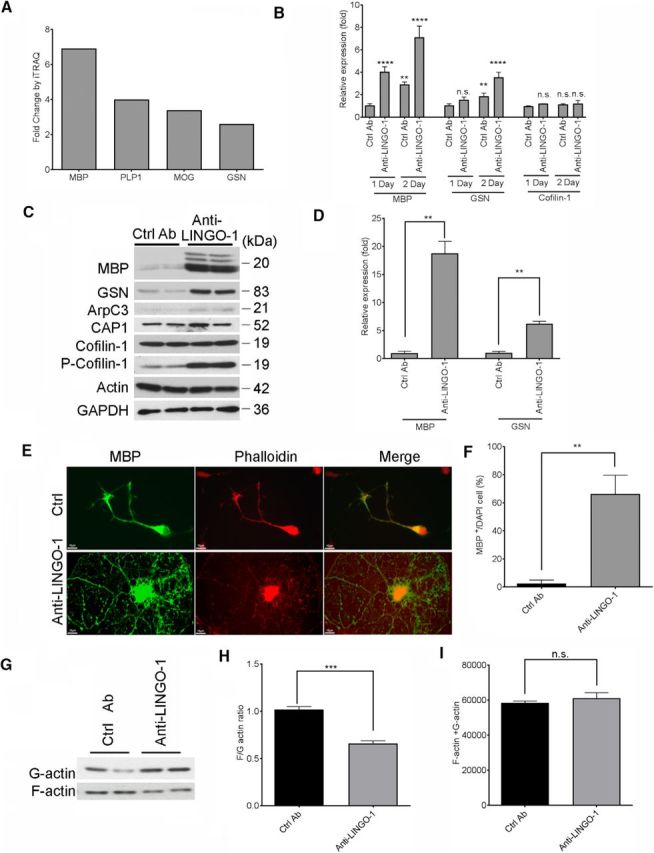
Figure 1.

Increased gelsolin expression and actin disassembly after anti-LINGO-1 antibody-induced oligodendrocyte differentiation. A, Proteins showing increased expression in oligodendrocytes after 3 d treatment of the anti-LINGO-1 antibody versus levels after control antibody treatment, quantified by iTRAQ proteomic analysis. B, Quantitative PCR analysis of MBP, GSN, and Cofilin-1 mRNA expression levels in primary rat OPCs cultured in differentiation medium treated with anti-LINGO-1 or control antibody (Ctrl Ab) for 1 or 2 d, with the expression in the sample treated by the Ctrl Ab for 1 d as 1. p-values were calculated by one-way ANOVA with Dunnett's multiple comparisons for each transcript, all compared with Ctrl Ab sample at 1 d (**p < 0.01, ****p < 0.001, n.s., not significant). C, Western blot analysis of GSN and MBP from rat OPCs differentiated for 3 d in the presence/absence of anti-LINGO-1 antibody. D, Quantification of MBP and GSN as shown in C with Image Studio software (LI-COR) and represented as the band intensity relative to actin with the value of Ctrl Ab-treated sample was set as 1. p = 0.0073 (MBP), p = 0.0051 (GSN), by two-tailed unpaired Student's t test. E, ICC of rat OPCs differentiated for 3 d and immunostained for MBP (green) and phalloidin (red). Scale bar, 10 μm. F, Quantification of MBP+ cells as a percentage of total cells (DAPI+). Average 10 fields per slide, total 3 slides. (p = 0.0012, by two-tailed unpaired Student's t test.) (G) Western blot analysis of F- and G-actin fractions from rat OPCs differentiated for 3 d in the presence/absence of anti-LINGO-1 antibody and separated according to the G-actin/F-actin in vivo assay kit (Cytoskeleton). H, Quantification of the band intensities of F- and G-actin shown in G and presented as F- to G-actin ratio. p = 0.0152; two-tailed unpaired Student's test. I, Quantification of total actin (F-actin + G-actin) level in G. n = 2 experiments, with 2 biological replicates per experiment. p = 0.2243.
