Figure 3.
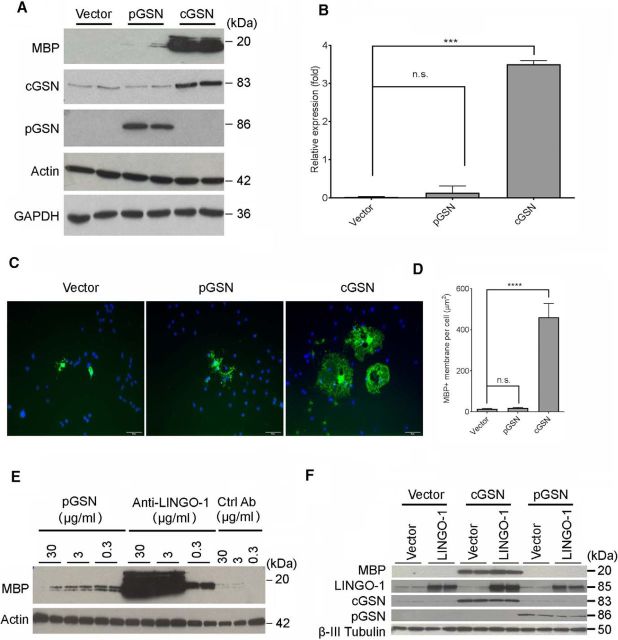
Overexpression cGSN promotes OPC differentiation. A, Western blot analysis of MBP, GSN, actin, and GAPDH protein expression in OPCs transfected with plasmids expressing cGSN, pGSN, or control vector for 3 d. pGSN expression was quantified in the culture medium. All other proteins were quantified from cell lysates. B, Quantification of the MBP protein shown in A, represented as band intensity relative to actin. p-values were calculated by one-way ANOVA with Dunnett's multiple comparisons compared with vector. ***p < 0.005, n.s., not significant. C, OPCs treated as in A were immunostained by anti-MBP antibody (green). Blue, DAPI. Scale bar, 50 μm. D, Quantification of myelin-like membrane area per cell shown in C. Average 6 fields per slide. n = 2 biological replicates. p-values were calculated by one-way ANOVA with Dunnett's multiple comparisons compared with vector. n.s., not significant; ****p < 0.001. E, Western blot analysis of MBP and actin expression in OPCs treated with recombinant pGSN or anti-LINGO-1 antibody for 3 d. F, Western blot analysis of MBP, GSN, LINGO-1, and β-III tubulin in OPCs transfected with plasmids expressing cGSN, pGSN, or control vector plus/minus a plasmid expressing LINGO-1 for 3 d.

