Figure 5.

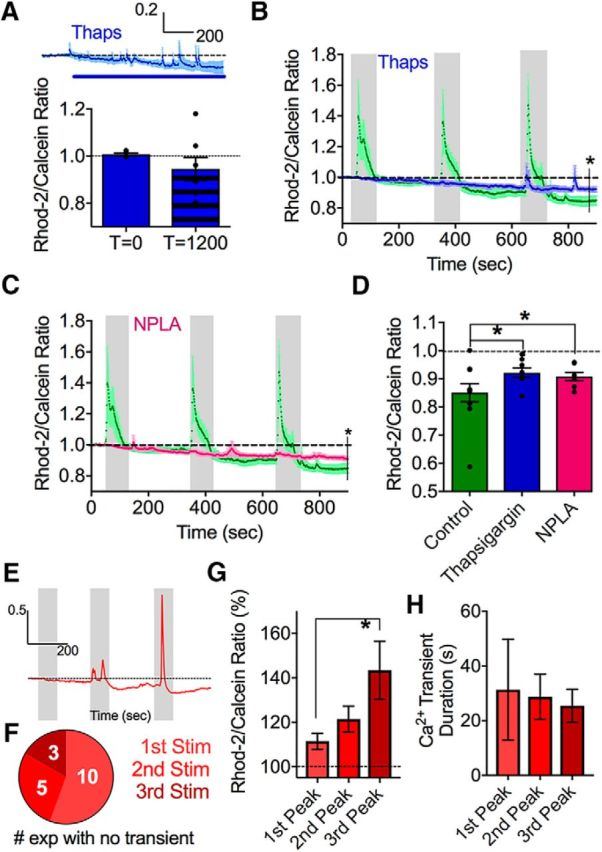
The drop in astrocyte resting Ca2+ partially involves NO and internal Ca2+ stores. A, A modest effect of the SERCA pump inhibitor thapsigargin on steady-state intracellular astrocyte Ca2+. Summary time course (above). Blue line indicates thapsigargin bath application. Bar graph (below) represents measurements at 0 and 1200 s. B, Summary of Ca2+ time course in response to successive bouts of theta burst stimulation in the presence of thapsigargin (blue) compared with control (green). C, Summary of Ca2+ time course in response to successive bouts of theta burst stimulation in the presence of the NOS1 enzyme antagonist NPLA (pink) compared with the control dataset (green). D, Summary bar graph after the 1.2 V stimulation comparing control, NPLA, and thapsigargin conditions. E, Representative trace showing how the evoked Ca2+ transients in astrocytes become larger with three successive theta burst stimulation at the same voltage (1 V). F, Pie chart showing that the chance of observing an evoked astrocyte Ca2+ transient increases with successive theta burst stimulations of a total of 16 experiments. G, Summary data of the evoked peak amplitude of astrocyte Ca2+ transients from the experiments shown in in E, F; failures omitted. H, Summary data of the duration of the evoked astrocyte Ca2+ transients from E, F; failures omitted. Error bars represent SEM. *p < 0.05.
