Figure 6.

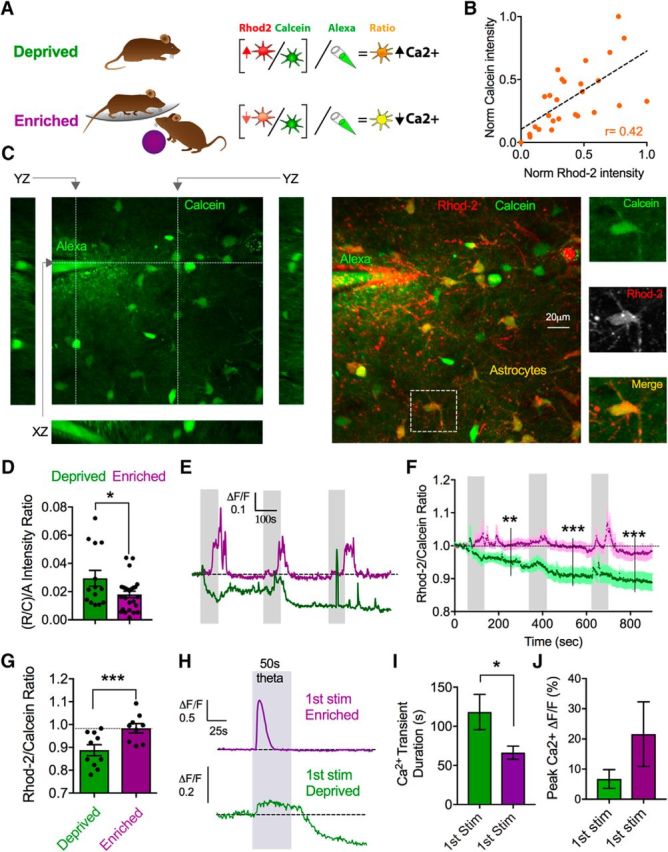
Experience decreases astrocyte resting Ca2+ and limits further changes in response to neural activity ex vivo. A, Diagram representing the deprived and enriched experimental groups and the imaging/analysis strategy to compare resting Ca2+, involving an additional ratio to a reference Alexa-488 pipette. B, Correlation plot of the relationship between baseline Calcein loading and baseline Rhod-2 loading in single astrocytes in control animals. C, z stack images of Calcein and Rhod-2 loaded cortical tissue incorporating a reference pipette containing Alexa-488 dye (200 μm). Images represent xy, yz, and xz views (left), merge xy Rhod-2 and Calcein view (middle), as well as a closeups of an astrocyte (right) indicated by a dashed-line box. D, Summary data comparing the baseline (Rhod-2/Calcein)/Alexa ratio in astrocytes from the deprived (green) or enriched (purple) experimental groups. E, Representative somata Ca2+ measurements (Rhod-2/Calcein ratio) in response to three successive theta burst stimulations from enriched (purple) and deprived (green) animals. F, G, Summary traces (F) and maximum effect after the third stimulation (G) of the same experiment in E. H, Representative traces of the first theta burst stimulation showing the magnitude and the duration of the evoked Ca2+ transient in astrocyte from enriched or deprived animals. I, J, Ca2+ signal duration (I) and magnitude (J) summary data from the experiment in H; failures omitted. Error bars represent SEM. *p < 0.05. **p < 0.01. ***p < 0.001.
