Figure 8.

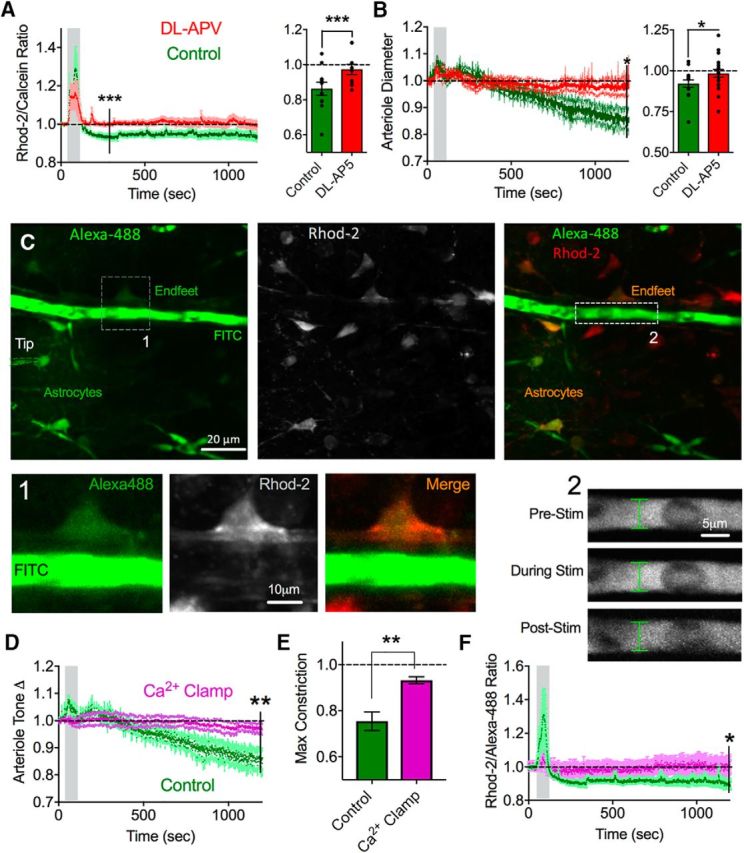
NMDAR antagonism or astrocyte Ca2+ clamp prevent the arteriole response to theta burst. A, Left, Summary endfoot Ca2+ average traces in response to theta burst in control (green) and in the presence of dl-APV (red). Right, Summary bar graph of maximum decrease in Ca2+ in the same experiments. Values were from individual experiment maximum decreases. B, Left, Summary of relative changes in arteriole tone in response to theta burst stimulation in control or in dl-APV. Right, Summary bar graph of the maximum vasoconstrictions in the same experiment. C, Representative images showing astrocyte patch-clamp setup for endfoot Ca2+ clamp. Left, Whole-cell astrocyte filling the astrocyte syncytium, including endfeet abutting an arteriole, with Alexa-488 dye. FITC dextran filled the lumen of the arteriole. Astrocytes were prestained with Rhod-2 AM (middle). Merged images (right). 1, Zoomed-in images of an arteriole lumen filled with FITC dextran and endfoot filled with Alexa-488 costained with Rhod-2. Green channel images were gamma filtered at 0.7 to better visualize relatively faint endfeet. 2, Zoomed-in images of arteriole diameter at varying time points in the stimulation period during endfoot Ca2+ clamp. D, Summary of relative changes to arteriole tone in the presence of Ca2+ clamp (pink) compared with control (green). E, Summary bar graph of maximum vasoconstriction in response to theta burst stimulation for control and Ca2+ clamp conditions. F, Summary endfoot Ca2+ time course in response to theta burst stimulation under endfoot Ca2+ clamp (pink) or control (green). Error bars represent SEM. *p < 0.05. **p < 0.01.
