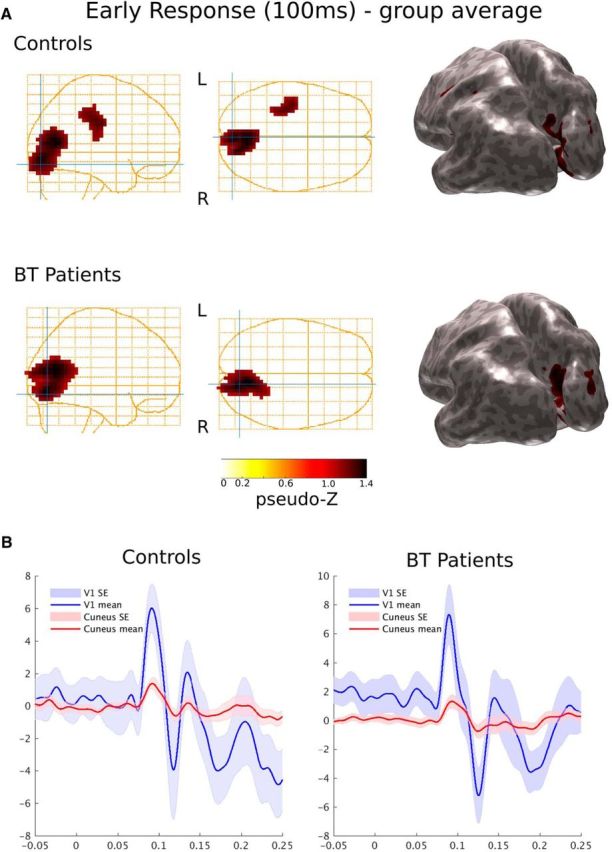
Figure 3.

Task-driven activation within V1 precedes cuneus synchrony for controls and children treated for brain tumor. A, Group activation (source power) following visual cue using event-related Synthetic Aperture Magnetometry (pseudo-Z, 1–60 Hz, p < 0.001) show activation within V1 and cuneus as represented on glass brain plots and inflated cortical mesh models for (top) controls (n = 26) and (bottom) patients treated for BT (n = 26). B, Plots representing the activation timing within V1 (blue trace) and cuneus (red trace) for controls and patients with their corresponding standard error (SE) at each time point.
