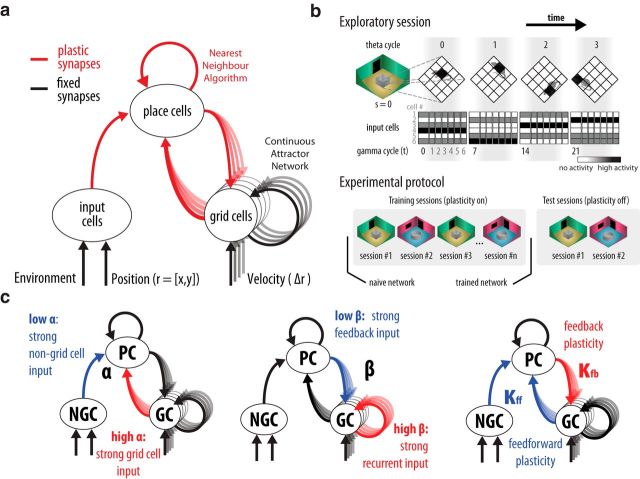
Figure 2.
Model of place and grid cell network with bidirectional connectivity. a, Circles denote neuronal populations. Arrows represent synaptic connections. Synapses are either fixed (black) or plastic (red). Place cells recurrent collaterals are modeled implicitly by a pattern completion process like a nearest neighbor algorithm which requires learning (Rennó-Costa et al., 2014). Place cell population adapted from Rennó-Costa et al. (2010, 2014; n = 5000 neurons). Grid cells recurrent collaterals are fixed and implement a continuous attractor network model as by Guanella et al. (2007; n = 816 neurons). Input cell population as by Rennó-Costa et al. (2010; n = 500 neurons). b, The experiment comprises the simulation of sequential sessions divided into training and test sessions. Each session has a characteristic context value (s) and a trajectory of position values (r). The rat stays at a position for a theta cycle (or 7 gamma cycles). The activity of input cells is determined in each gamma cycle based on the position and context values. The naive network is the network prior the training sessions whereas the trained network is the network after the training sessions. Analyses are performed on data collected during the test sessions. c, Model parameters. α denotes connection strength from grid to place cells normalized by the overall feedforward connection strength reaching the place cells . β denotes the normalized strength of the recurrent connections among grid cells in relation to the feedback connection strength from place to grid cells . κfb and κff denote learning rate for the feedback and feedforward synapses, respectively. NGC, Non-grid cells (input cells); PC, place cells; GC, grid cells. Default parameters: α = 0.1; β = 0.7; κfb = 0.5; κff = 0.01.

