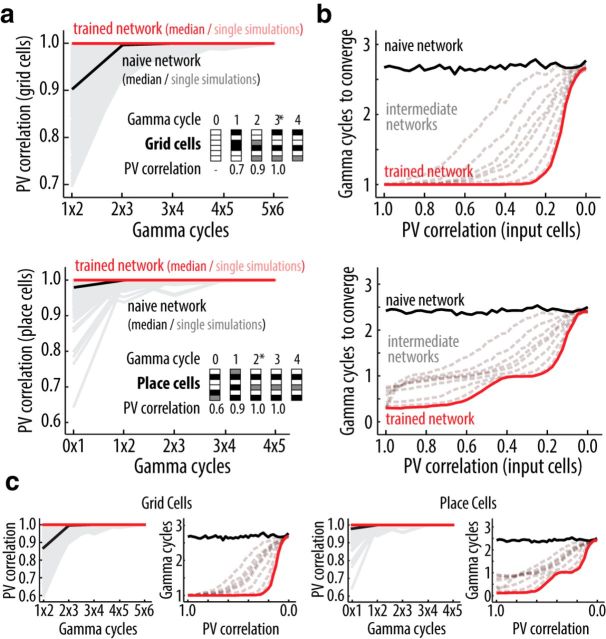
Figure 3.
Network convergence within one theta cycle. a, Average correlation between the patterns of ensemble activity (PVs) of grid (top) and place cells (bottom) in two subsequent gamma cycles. Median (solid lines) and single simulations (shaded lines) results shown for naive (black) and trained networks (red). Network activity is stable when the PV correlation between subsequent gamma cycles is >0.99. Insets, Color-coded PVs for a sample of six cells across different gamma cycles, along with corresponding cycle-to-cycle PV correlations. *Indicates the gamma cycle in which the network converged. Note that grid cells in the first cycle are silent since the place cell input from the previous cycle is not defined. b, Average number of gamma cycles required for grid (top) and place cell (bottom) network convergence as a function of the PV correlation between the input patterns of training and test sessions. Results shown for naive (solid black line, 0 training sessions), intermediate [dashed gray lines, (2, 5, 10, 20, 30, 40) training sessions], and trained (solid red line, 50 training sessions) networks. c, as in a and b, but for simulations performed with the alternative model.

