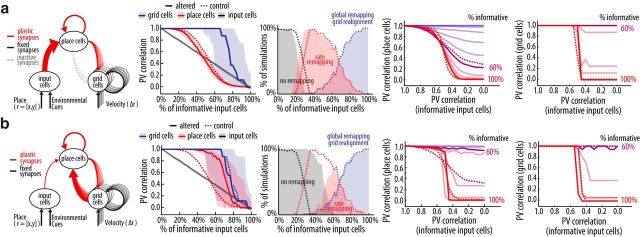
Figure 7.
Effects of the relative strength of grid cell input on place cell remapping and grid realignment. Left, Variations of the model described in Figure 2, as follows: a, grid cell input to place cells is set to 0% of the overall input strength; b, grid cell input to place cells is set to 40% of the overall input strength. Second to fifth panels as in Figure 5d–g. Results of the control network (Fig. 5) are reproduced as dashed lines; in the fourth and fifth panels, only PV curves for 60% and 100% informative inputs of the control network are shown.

