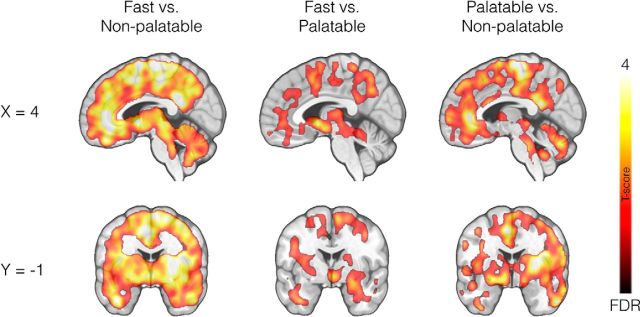
Figure 2.
Full-volume analysis. Brain regions where [11C]carfentanil BPND values were different between fasting and the nonpalatable meal (left), fasting and the palatable meal (middle), and the palatable meal and the nonpalatable meal (right). The data are thresholded at p < 0.05, FDR corrected at cluster level. The color bar shows the t statistic range.

