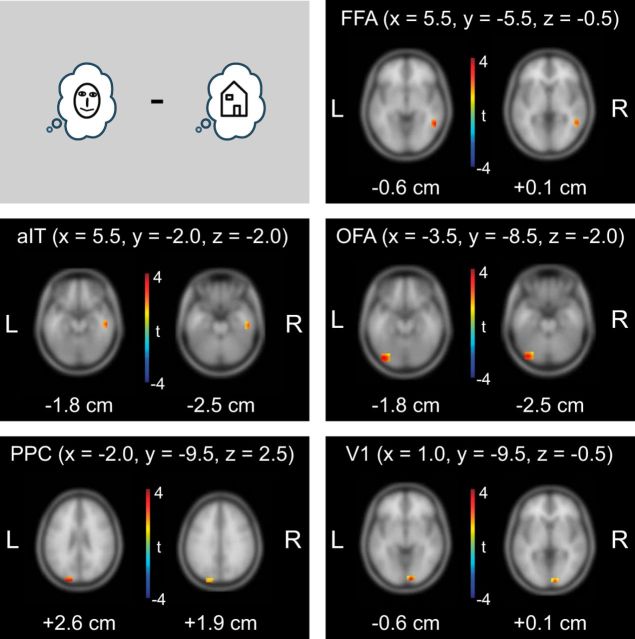
Figure 4.
Statistical analysis of predictable information (measured by AIS) at the MEG source level. Results of whole-brain dependent samples permutation t metric contrasting Face blocks and House blocks (n = 52, t values masked by p < 0.05, cluster correction). Peak voxel coordinates in MNI space are shown at the top for each brain location; z values are displayed below each brain slice.

