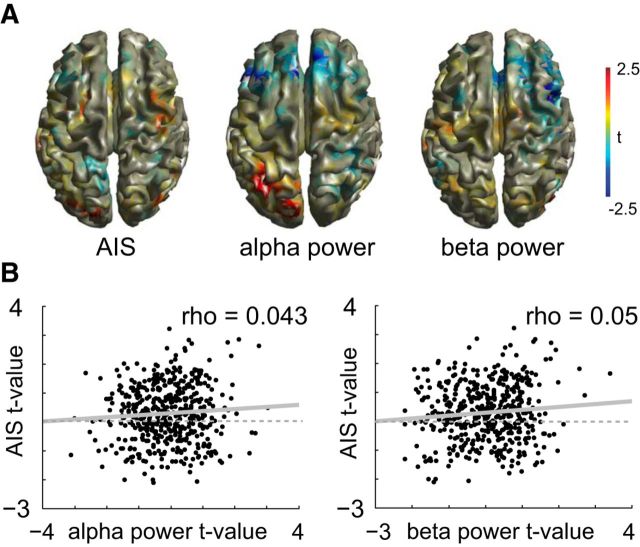
Figure 5.
Correlation of predictable information contrast maps and source power contrast maps. A, Illustration of the t-value maps of the dependent samples t metric for the Face-block versus House-block contrast (n = 52, no correction) on the cortical surface. B, Scatter plots of the relationship of the α/β contrast and the AIS contrast. Each dot represents a source location within the brain. Spearman correlation values are displayed at the top right corner of each plot (n = 478). Linear regression lines are included in gray (solid).

