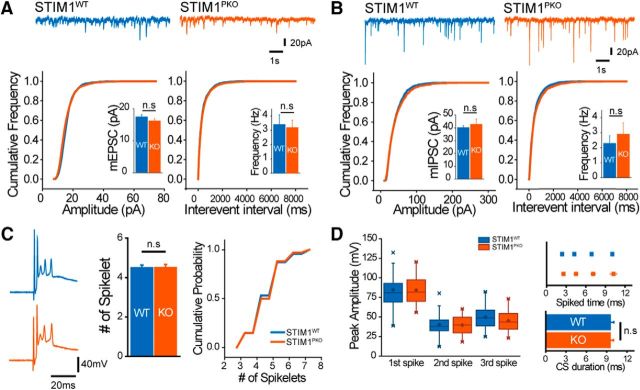
Figure 9.
Basal synaptic transmission and climbing fiber activity remained intact in PNs of STIM1PKO mice. A, Miniature EPSCs. Representative trace of mEPSCs recorded from wild-type and STIM1PKO (top). Cumulative distribution plots of frequency (bottom left) and amplitude (bottom right). In both frequency and amplitude, there was no statistical significance between both groups (wild-type, n = 8; STIM1PKO, n = 11; amplitude, p = 0.206; frequency, p = 1.000). B, Miniature IPSCs. Data are presented same as in A, and there were no differences between wild-type and STIM1PKO mice (wild-type, n = 5; STIM1PKO, n = 7; amplitude, p = 0.639; frequency, p = 0.876). C, The number of CS spikelets in both groups was the same. Representative trace of CSs induced by CF stimulation from whole-cell recording (left). Average number (p = 0.884, center) and probability (right) of the spikelets were almost the same (wild-type, n = 30; STIM1PKO, n = 34). D, Properties of each spikelet showed no statistically significant differences between both groups. The peak amplitude of each spikelet was not significantly different between wild-type and STIM1PKO mice (first spike, p = 0.935; second spike, p = 0.792; third spike, p = 0.145; left). The times when each spikelet appeared (first spike, p = 0.412; second spike, p = 0.385; third spike, p = 0.494; fourth spike, p = 0.724; top, right) and the total spike duration (p = 0.968, bottom, right) were also unchanged. A Mann–Whitney U test was used for bar graphs in A and B. An independent-samples t test was used for C and D. Error bars denote the SEM.

