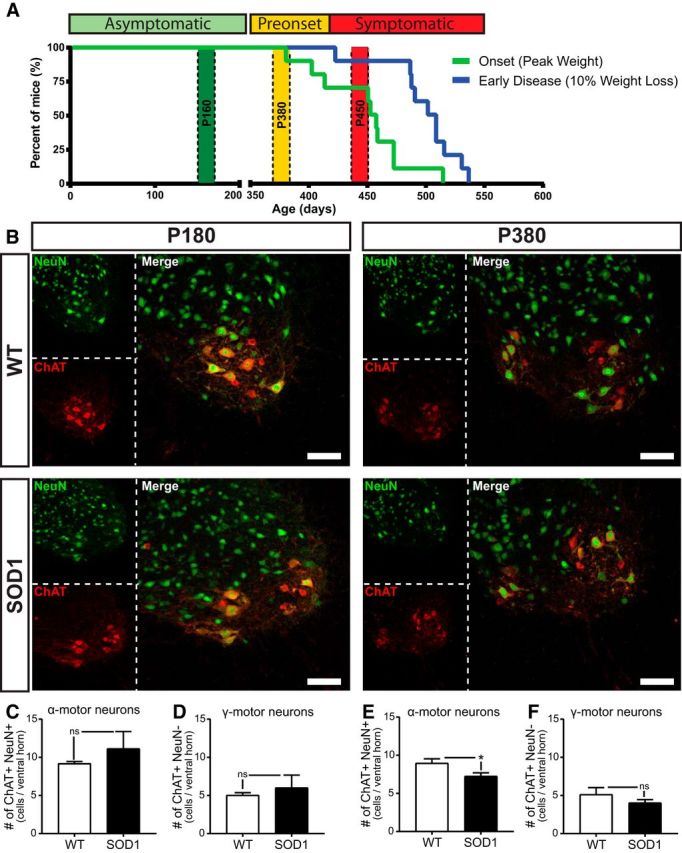
Figure 1.

Disease progression and motor neuron death in the SOD1G37R mouse model. A, Percentage of mice reaching disease onset (pale green line) and early disease (blue line). Based on symptoms and clinical nomenclature, the asymptomatic period (green zone) was defined from birth until P350, the presymptomatic (preonset) stage (yellow zone) from P350 until P400 approximately, and the symptomatic stage (red zone) started at ∼P400 lasting until the end-stage at P525 to P600. We investigated three time periods corresponding to the three stages represented in the figure: P180, P380, and P450. WT, N = 10; SOD1, N = 9. B, Confocal images of immunohistological labeling of motor neurons in the ventral horn of a lombar spinal cord section: neuronal-specific nuclear protein (NeuN; green) and choline acetyltransferase (ChAT; red) were immunolabeled on spinal cord cross sections of WT mice (top panels) and SOD1 mice (bottom panels) at P180 (left) and P380 (right). Neurons in the ventral horn were identified as α-MNs when brightly labeled for both NeuN and ChAT and were identified as γ- MNs when labeled with ChAT but weakly or not labeled for NeuN. C–F, Histograms showing the mean ± SEM of the number of α-MNs (C) and γ-MNs (D) at P180 and α-MNs (E) and γ-MNs (F) at P380. Note the selective reduction of α-MNs in the mutant mouse at P380, without any loss of γ-MNs. Scale bars, 100 μm. *p < 0.05.
