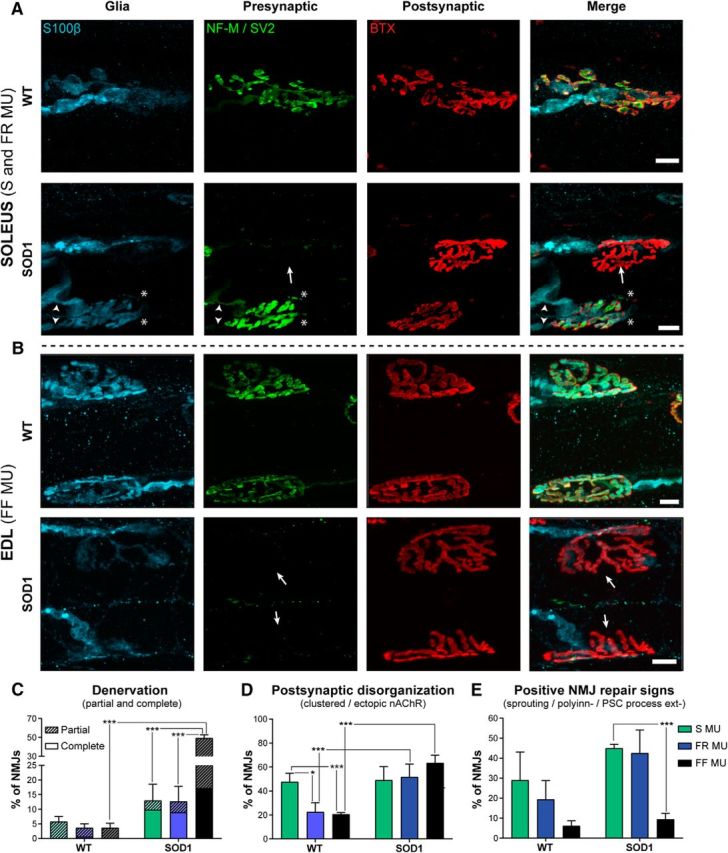
Figure 4.

Differential NMJ morphological alterations at clinical disease onset (P450). A, B, Confocal false color images of the three synaptic compartments of the NMJ: glia (S100β, blue), presynaptic nerve terminal (NF-M and SV2, green), and postsynaptic end plate (nAChRs; α-bungarotoxin, red) for WT and SOD1 NMJs. Note the presence of denervated NMJs in the SOL and the EDL (A, bottom) and EDL (B, bottom) of SOD1 mice (arrows), as well as polyinnervation and nerve terminal sprouting in the SOD1 SOL (A, arrowheads and asterisks, respectively). Immunohistochemical analysis was performed as in Figure 3. C–E, Histograms showing the mean ± SEM of the percentage of NMJs with partial or complete denervation (C), with faint, clustered, or ectopic nAChRs (D), or with nerve sprouting, polyinnervation, or PSC process extensions (E). Note the major deterioration of NMJs of the EDL compared with the ones of the SOL. *p < 0.05; ***p < 0.001, GLM.
