Figure 5.
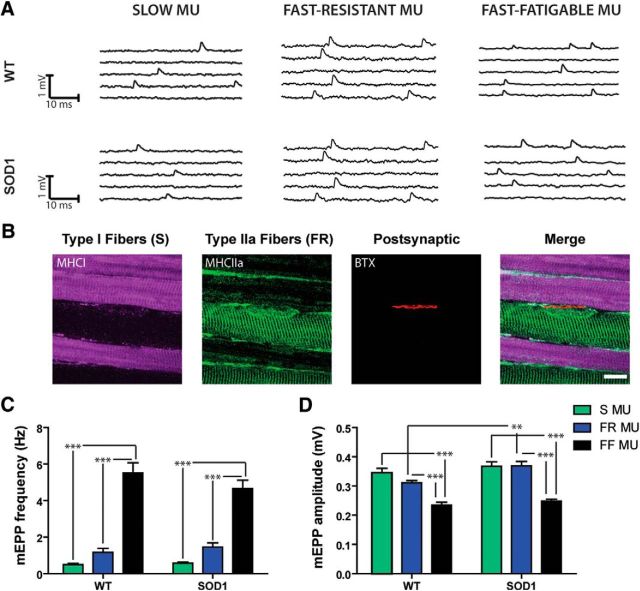
Unaltered spontaneous activity at P180 in S, FR, and FF NMJs. A, Typical traces of mEPP for S (left), FR (center), and FF (right) NMJs of WT and SOD1G37R mice. B, Confocal false color images showing fiber type identification and labeling of the SOL muscle: S MHC (MHC 1, purple), FR MHC (MHC IIa, green), and postsynaptic nAChRs (α-BuTX, red). Note the alternance of the two MU types at the surface of the SOL muscle. C, D, Histograms showing the mean ± SEM of mEPP frequency (C) and mEPP amplitude (D) for S (in green), FR (in blue), and FF NMJs (in black). Note the gradual increase in mEPP frequency as a function of the MU type, which is similar for WT and SOD1G37R NMJs. However, the relative mEPP amplitude of SOD1 NMJs did not follow the pattern observed in WT littermates as the mEPP amplitude of FR MU was larger in SOD1 than WT mice. **p < 0.01; ***p < 0.001. Scale bar in B, 10 μm.

