Figure 8.
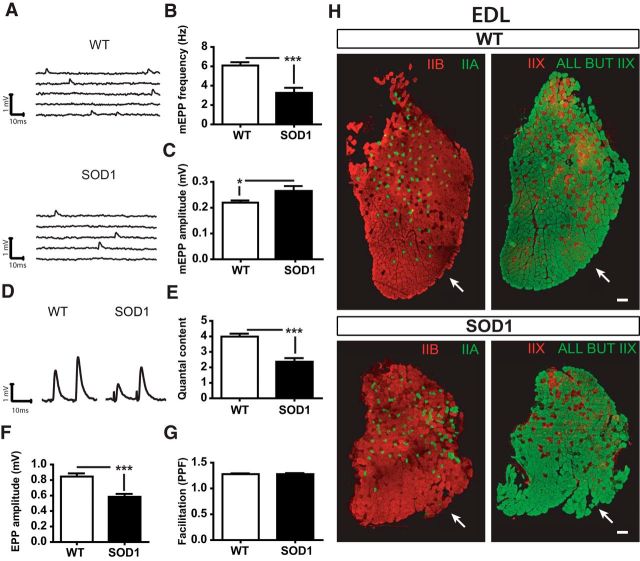
Persistent and additional synaptic changes at P380 in the EDL. A, Examples of mEPPs in control (WT) and SOD1G37R mice. B, C, Histograms showing the mean ± SEM of mEPP frequency (B) and amplitude (C) in FF NMJs. D, Traces of EPPs from WT and SOD1 FF NMJs. E–G, Histograms showing the mean ± SEM of EPP amplitude (E), quantal content (F), and paired-pulse facilitation ratio (G). H, Transverse cross sections of an EDL muscle (WT, top; SOD1, bottom) showing fiber type labeling of three MHCs. Left panels, MHC IIa (in green) and MHC IIb (in red); right panels: MHCs all but MHCIIx (in green) and MHCIIx (by extension, in red). Note that the type of MHC at the surface recorded in our experiments (arrow) did not change during the course of the disease despite the atrophy of the muscle (bottom panels). Scale bar, 100 μm. *p < 0.05; ***p < 0.001.

