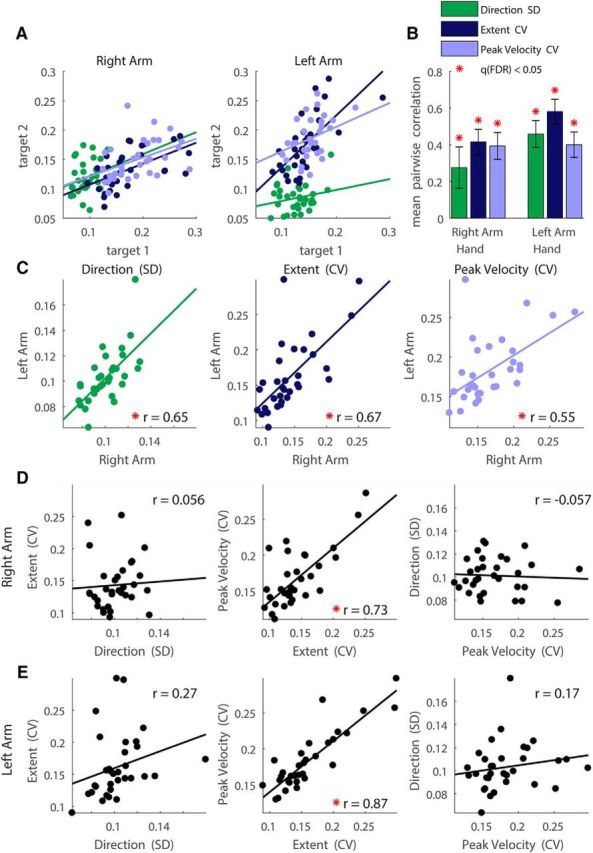
Figure 2.

Kinematic variability correlations. We computed the intertrial variability of movement direction (green), extent (dark blue), and peak velocity (light blue) across movements to each target for each of the subjects. A, Individual magnitudes of intertrial variability were strongly correlated across the two proximal targets (i.e., regardless of direction). B, Means and SEM of the Pearson correlations of the variability across all pairs of targets. Significant correlations are marked with asterisks. C, Scatter plots of the kinematic variability, averaged across targets, of the right and left arms. Each data point represents variability of movements of a single subject. D, E, Scatter plots of the kinematic variability, averaged across targets, of the right (D) and the left (E) arms. For all scatter plots, data points represent different subjects and lines represent linear fits. Significant correlations are marked with red asterisks.
