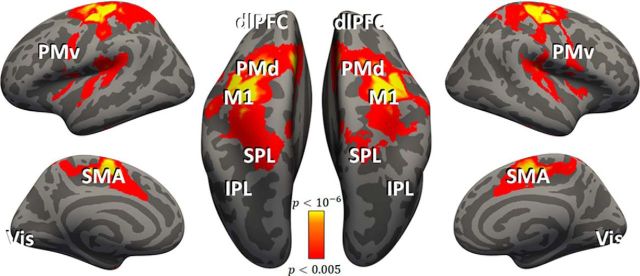
Figure 3.
Cortical activation during movement execution. Cortical areas that exhibited larger responses during movement than rest are shown in red/orange. Results were calculated across all subjects (random-effects GLM) and displayed on inflated hemispheres of a template brain. The general locations of the selected ROIs are noted (actual ROIs were anatomically and functionally defined in each subject; see Materials and Methods): M1, PMd, PMv, SMA, IPL, SPL, dlPFC, and Vis.

