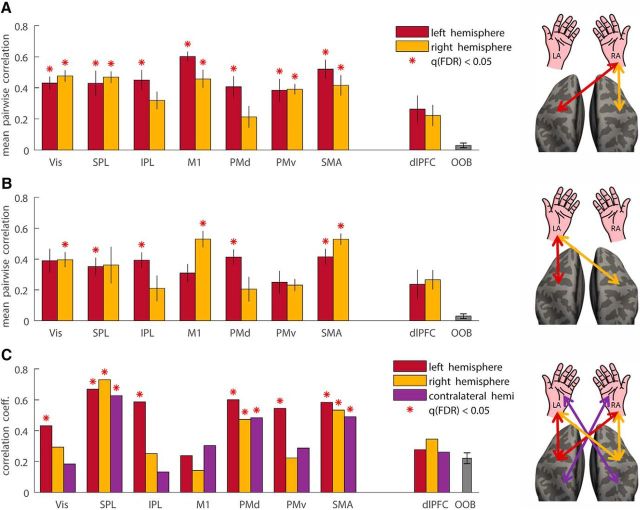
Figure 5.
Cortical variability correlations. fMRI variability magnitudes during right (A) and left (B) arm movements were correlated across all target pairs. Mean pairwise correlation coefficients are presented for each left hemisphere (red) and right hemisphere (yellow) ROI. C, fMRI variability magnitudes were correlated across right and left arm movements in left hemisphere ROIs (red), right hemisphere ROIs (yellow), and contralateral ROIs (purple). Significant correlations are marked with red asterisks.

