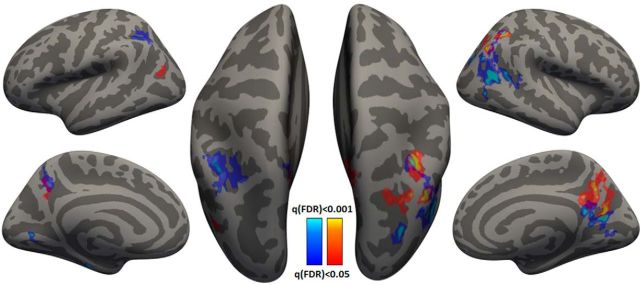
Figure 7.
Searchlight analysis displaying cortical areas with significant correlations between movement extent variability and fMRI variability across subjects. Results for right (red) and left (blue) arm movements are presented on the inflated cortical anatomy of a single subject. Correlation significance was determined based on a Student's t test (FDR corrected).

