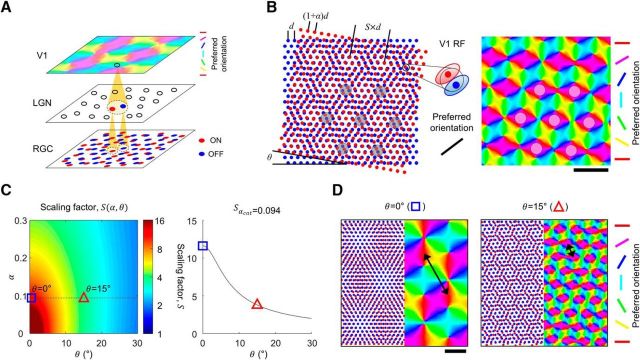
Figure 1.
Retinal origin of cortical orientation map and its variation of spatial organization. A, Developmental model of orientation map as feedforward projection of ON and OFF retinal mosaics. Receptive field of a V1 neuron is organized from the local projection of ON and OFF retinal mosaics. B, The period of the retinal moiré interference pattern (scaling factor, S) is a function of the lattice spacing ratio (α) and the alignment angle (θ) between ON and OFF RGC mosaics. Orientation tuning of a V1 cell is decided from the local structure of ON and OFF RGC mosaics with feedforward wiring, thus the periodic retinal interference pattern seeds a cortical orientation map. Scale bar, S. C, Left, scaling factor S as a function of α and θ. Right, variation in the calculated value of S, when α is fixed to 0.094 as estimated from cat data (Zhan and Troy, 2000). D, Sample orientation maps developed by moiré interference of RGC mosaics for α = 0.094. Spatial period of maps appear to vary significantly for different value of θ Left, S = 11.7 of developed map for θ = 0°. Right, S = 3.8 for θ = 15°. Black arrows indicate spatial period of maps. Scale bar, 5d.

