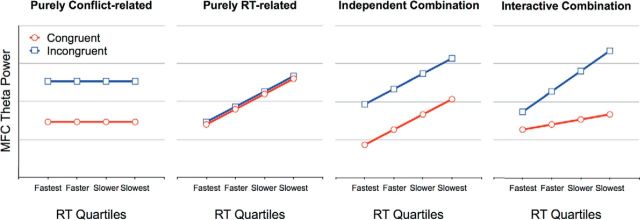
Figure 4.
Hypothetical data patterns for MFC theta power. Left panels, Predicted MFC theta increases produced by a pure conflict-related versus a pure RT-related modulation. Right panels, Predicted MFC theta increases produced by a combination of both conflict- and RT-related modulations, determining MFC theta power either independently of one another or interactively. In all hypothetical scenarios, each RT quartile is assumed to correspond to the same bounds for congruent (red lines) and incongruent trials (blue lines).

