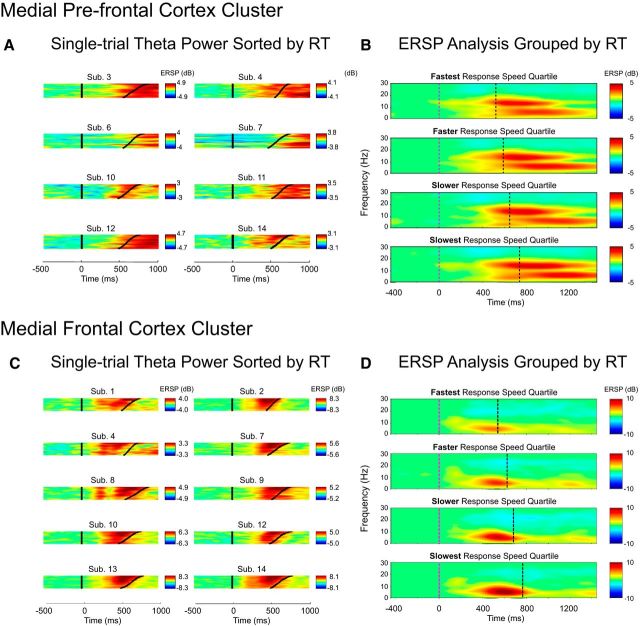
Figure 5.
fmθ power changes across congruent and incongruent trials sorted by RT and synchronized to stimulus onsets (at time 0). A, Spectrographic images of all trials sorted by RT for each of the 8 participants contributing to the MPFC cluster. B, MPFC ERSPs for trials in four RT-sorted groups (fastest, faster, slower, slowest). C, Spectrographic images of all trials sorted by RT for each of the 10 participants contributing to the MFC cluster. Note the higher mean theta power before slower responses (top traces in each panel). D, MFC ERSPs for trials in four RT-sorted groups (very fast, fast, slow, very slow). Note, again, that the theta power increase is larger in slower RT trials.

