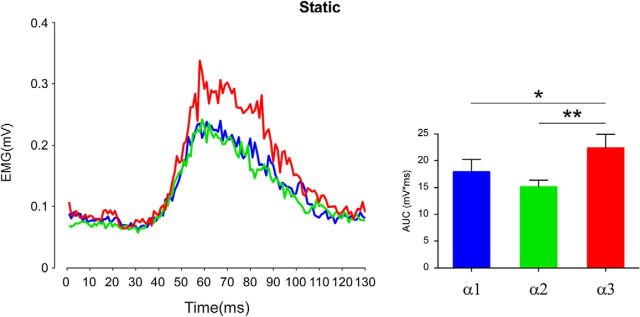
Figure 2.
Preliminary experiment: static condition. Group-average, rectified HBR waveforms (left) and group-average HBR amplitudes (right, AUC, mV × ms) recorded when the arm was placed in the three stimulation positions: far (α1), intermediate (α2), and near (α3). Error bars indicate standard error. **p < 0.01, *p < 0.05.

