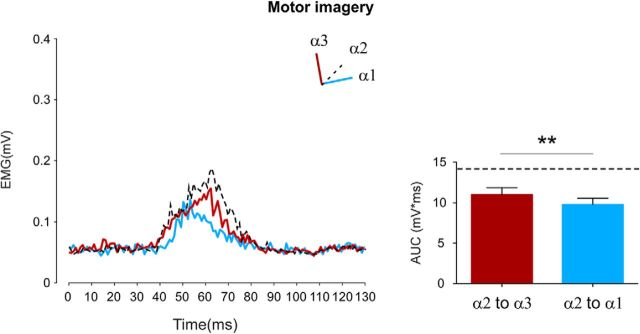
Figure 6.
Experiment 3A: motor imagery. Group-average, rectified HBR waveforms (left) and group-average HBR amplitudes (right, AUC, mV × ms) when participants were asked to imagine to move the forearm from the intermediate to the near position (α2 to α3) and from the intermediate to the far position (α2 to α1). Dashed lines indicate the HBR waveform (left) and response amplitude (right) obtained in static condition corresponding to α2. Error bars indicate standard error. **p < 0.01.

