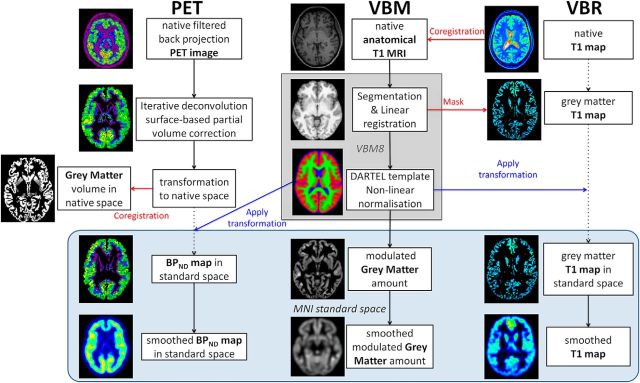
Figure 2.
Processing pipelines. Middle, VBM analysis of GMVs. Other panels, Voxel-based analysis pipelines that we developed specifically for analysis of BPND maps for flumazenil PET (left), and voxel-based relaxometry (VBR) analysis of T1 maps, a surrogate marker of water content (right). Blue box represents data in standard space (MNI space).

