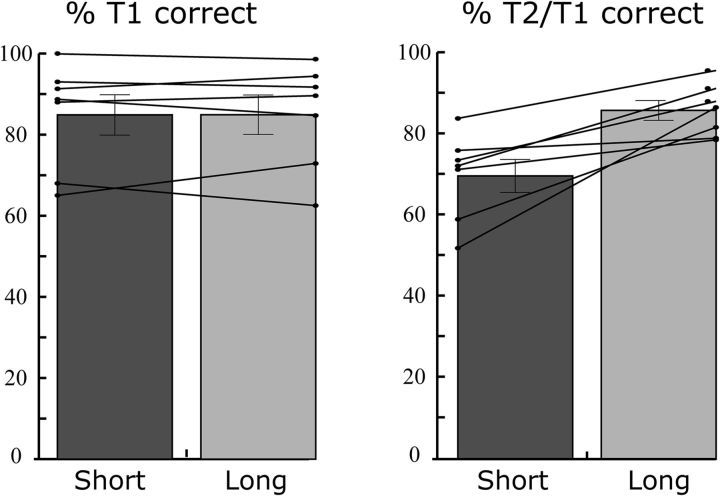
Figure 2.
AB task performance. Percentage T1 accuracy (left) and percentage T2 accurate given T1 correct (T2/T1) (right) are shown separately for short (200 ms) and long (800 ms) T1–T2 interval trials, for each patient (lines) and at the group level (bars). As shown, a robust AB was observed as reflected by lower T2/T1 accuracy in short interval compared with long interval trials. Error bars indicate SEM.

