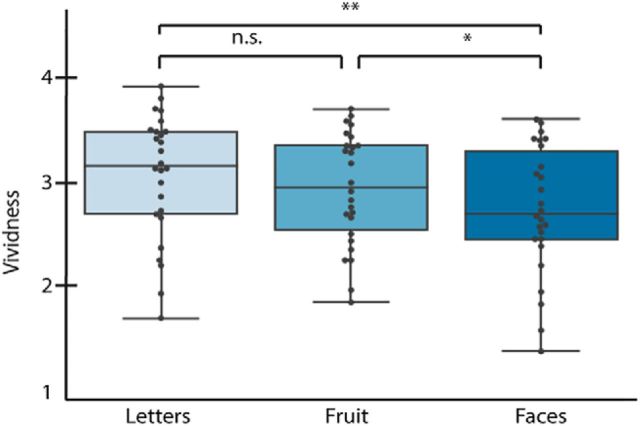
Figure 2.
Average trial-by-trial vividness ratings for the different stimulus categories. For each box: the central mark indicates the median, the edges of the box indicate the 25th and 75th percentiles, and the whisker indicates the minimum and maximum values. Each dot indicates the average for one participant. *p < 0.05. **p < 0.01.

