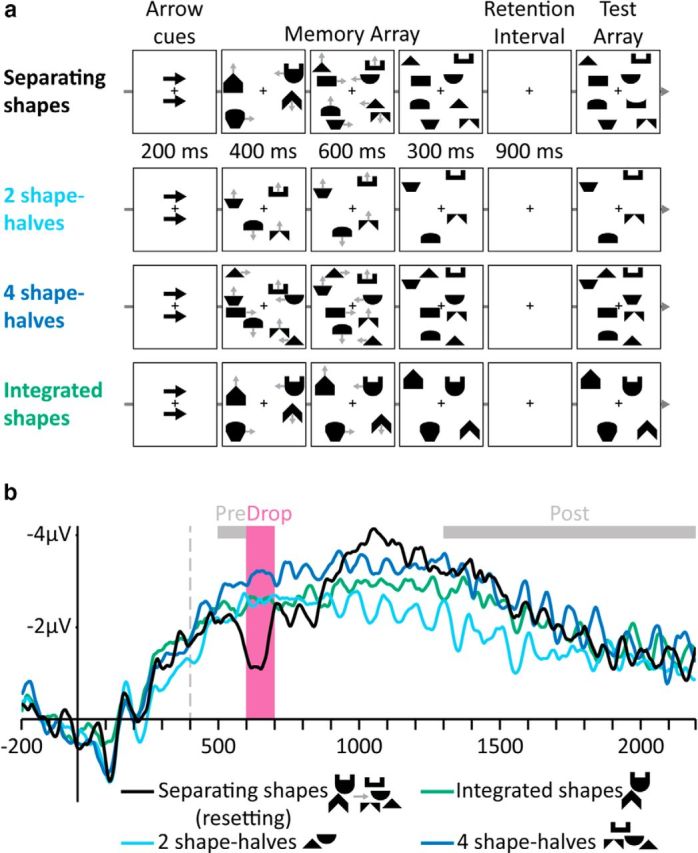
Figure 1.

Stimuli and results of Experiment 1. a, Examples of trials in the different conditions (gray arrows indicate movement directions and were not presented). Top to bottom, Separating shapes, Two shape-halves, Four shape-halves, and Integrated shapes. b, Grand-averaged CDA waves (averaged across the P7/8, PO3/4, and PO7/8 electrodes) time locked to memory array presentation. Negative voltage is plotted upward. The vertical dashed line depicts the time of separation. Analyzed time windows are depicted by colored rectangles: Drop (pink), in which the amplitude of the Separating shapes condition dropped, and Pre- and Post-Drop (gray).
