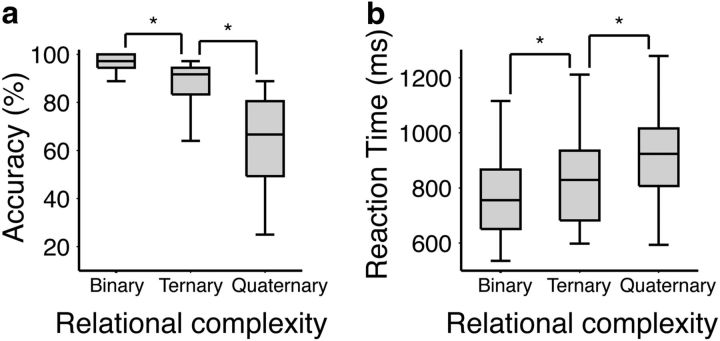
Figure 2.
Behavioral results for the LST visualized as box-and-whisker plots. Here the boxes represent the median and interquartile ranges, and the whiskers show the minimum and maximum values. a, Accuracy as a function of reasoning complexity. b, Reaction time as a function of reasoning complexity. Significance markers indicate p < 0.001.

