
Figure 3.
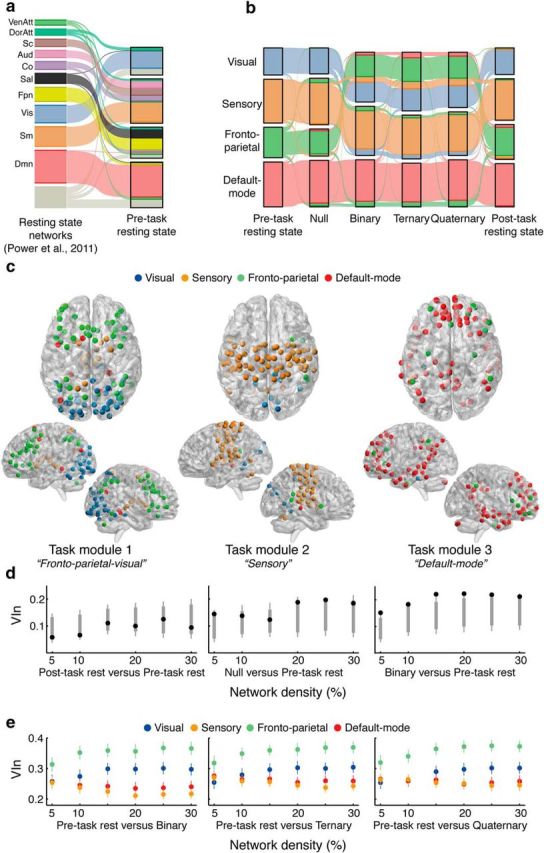
Modular structure as a function of reasoning complexity in the LST. a, Alluvial “flow” demonstrating the network affiliations (Power et al., 2011) compared with the Pre-task resting-state (Rosvall et al., 2009). Each individual streamline represents a node in the network, colored by its original resting-state affiliation as shown on the left (Power et al., 2011). b, VenAtt, Ventral attention; DorAtt, dorsal attention; Sc, subcortical; Aud, auditory; Co, cingulo-opercular; Sal, salience; Fpn, fronto-parietal; Vis, visual; Sm, sensorimotor; Dmn, default-mode. Changes in modular structure across the experimental conditions. Visual and frontoparietal modules merged to form a task-related module during Binary, Ternary, and Quaternary conditions of the LST. Results for 15% network density are shown, but statistics were performed across several thresholds. c, Anatomical rendering of the task-related modules in the Quaternary condition. Each sphere is color-coded by its initial resting-state module allegiance. d, VIn values (black markers) compared with a null distribution (gray markers: fifth–95th percentile in bold line; first–99th percentile shown in tails) for the three main contrasts across all network densities. Only the right-most contrast (Binary vs Pre-task rest) showed a consistent difference between partitions. e, Comparison of VIn values across visual, sensory, frontoparietal, and default-mode modules in each task condition compared with rest across all network densities. The frontoparietal module was consistently more variable in relation to other modules. Error bars represent 95% confidence intervals.